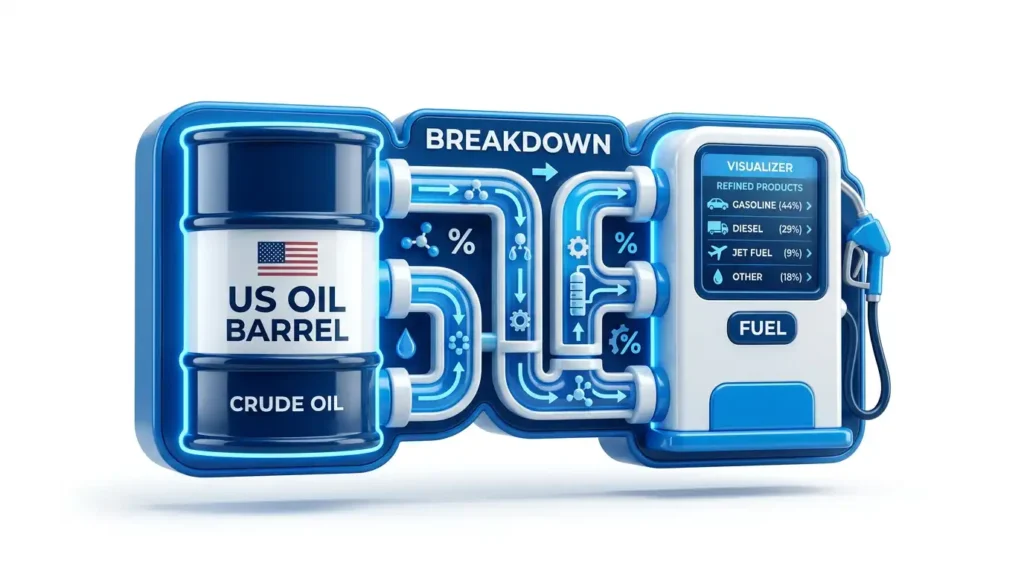
US Oil Barrel to Pump Breakdown Visualizer
Barrel-to-pump visualizer for U.S. oil products
Move the crude and tax controls to see how one barrel of oil turns into gasoline, diesel, jet fuel, LPG, asphalt, lubricants, petrochemical feedstocks, and other outputs, while the model updates product values, road-fuel taxes, company gross margin, annual U.S. tax revenue, and annual modeled corporate revenue.
Crude oil price
Adjust the input barrel cost used across the full refinery model.
Road-fuel tax multiplier
Scales the U.S. average gasoline and diesel tax layer used in the pump estimator.
Scenario presets
Use preset combinations, then fine-tune with the sliders.
How one U.S. barrel breaks apart
Equivalent output shares based on U.S. refinery yields, including processing-gain effects inside the yield mix.
Regular gasoline stack
Crude oil, refining, logistics/marketing, taxes, and modeled company margin.
Diesel stack
Modeled U.S. on-highway diesel build-up using the same adjustable tax logic.
Final products from the barrel
Road fuels use a grounded U.S. pump build-up. Other products use a transparent U.S.-style wholesale/value model so the entire barrel can be visualized in one place.
What this model is doing
The widget translates one 42-gallon U.S. input barrel into a yield-based output mix, then layers on crude cost, refining/processing, shipping and marketing, road-fuel taxes, and modeled gross profit so users can see where the money goes across the barrel.
Impact versus baseline preset
See how your slider settings change road-fuel tax intake and modeled company gross margin from one barrel.
Annual U.S. scale estimate
Annualized from the slider settings using forecast U.S. gasoline demand, distillate demand, and refinery crude input.
Disclaimer: This barrel-to-pump visualizer is provided for educational and illustrative purposes only and uses modeled estimates based on typical U.S. refinery yields, publicly available industry averages, and simplified assumptions about crude pricing, refining costs, logistics, taxes, and company margins. Actual fuel prices, refinery output mixes, taxes, and corporate revenues vary significantly by region, refinery configuration, market conditions, government policy, and real-time supply and demand factors. The calculations shown should not be interpreted as precise economic forecasts, financial data, investment advice, or official industry statistics. TimeTrex makes no guarantees regarding the accuracy, completeness, or timeliness of the information presented, and users should rely on official government reports, energy market data providers, and professional financial guidance for decisions related to energy markets, taxation, or business strategy.
Found our Free US Oil Barrel to Pump Breakdown Visualizer useful? Bookmark and share it.
TL;DR
Understanding the lifecycle of U.S. gasoline and the underlying crude oil economics is essential to grasping why retail gasoline prices fluctuate. The U.S. gasoline supply chain is a highly complex, capital-intensive network spanning upstream exploration, midstream transit, downstream refining, and final retail distribution. While the baseline cost of crude oil dictates roughly half the retail price, gasoline refining margins, long-haul distribution costs, and fixed government taxation are securing increasingly larger shares of the consumer's dollar. As domestic refining capacity tightens, local gas stations operate on razor-thin margins, relying heavily on convenience store sales to survive the volatile motor gasoline lifecycle.
Article Index
- TL;DR
- Introduction to the Gasoline Supply Chain
- Upstream Economics: Crude Oil Exploration and Extraction
- Midstream Transit: Moving Crude to the Refinery
- The Refining Process: Chemical Transformation, Timelines, and Margins
- Downstream Distribution: Pipelines, Terminals, and Blending
- Retail Economics: The Station at the Pump
- The Role of Taxation: The Fixed Floor of Gasoline Prices
- Macroeconomic Forces and Geopolitical Forecasting (2026-2027)
- Conclusion
Introduction to the Gasoline Supply Chain
The retail price of motor gasoline is arguably the most visible, frequently monitored, and politically sensitive macroeconomic indicator in the global economy. For the typical consumer, the cost required to fill a vehicle's fuel tank is often interpreted as a direct reflection of domestic economic health, inflation, corporate profiteering, or geopolitical stability. However, the price displayed on the marquee of a local retail station is the culmination of a highly complex, globally integrated, and immensely capital-intensive supply chain. The lifecycle of a gallon of motor gasoline, from its initial extraction as crude oil deep within subterranean geological formations to its final combustion in an internal combustion engine, spans a timeline typically ranging from two weeks to one full month. This duration is dictated by a sequential flow of upstream exploration and production, midstream transportation, downstream refining, secondary distribution, terminal blending, and final last-mile retail distribution.
To systematically understand why a gallon of gasoline costs what it does, it is necessary to deconstruct the final retail price into its four primary constituent economic components: the cost of crude oil, refining costs and corporate profits, distribution and marketing expenses, and government taxation. Historically, the retail price of motor gasoline has been dominated by the cost of crude oil. In 2023, for instance, the national annual average retail price for regular-grade gasoline was $3.52 per gallon, with crude oil accounting for approximately 52.6% of that cost. Refining costs and profits accounted for 18.7%, distribution and marketing for 14.3%, and taxes for 14.4%.
What Are You Actually Paying For?
When you see the price flashing on the gas station marquee, you are paying for four distinct phases of the supply chain. The largest variable is the global price of crude oil, which is dictated by international supply and demand. Refining, distribution, and taxes make up the rest, remaining relatively stable compared to crude oil fluctuations.
Key Takeaway:
Over half the price of gasoline is determined before it ever reaches a refinery. The retailer controls the smallest fraction of the final price.
Average Cost Breakdown of a Gallon
However, as the global energy market transitions through 2025 and into 2026, structural shifts in domestic refinery capacity, international geopolitical conflicts, and evolving environmental regulatory frameworks have altered this traditional proportional distribution. Forecasts from the U.S. Energy Information Administration (EIA) for 2026 and 2027 indicate that crude oil's relative contribution to the retail average gasoline price is expected to fall below 45% on an annual average basis. This proportional decline is driven by expanding refinery margins, tightening refining capacity, and escalating secondary distribution costs.
This report provides an exhaustive, granular analysis of every node in the motor gasoline supply chain. By tracking the physical and financial journey of a barrel of crude oil as it is transformed into finished motor gasoline, this analysis elucidates the precise chronological timelines, operational expenditures, corporate profit margins, tax burdens, and exogenous market forces that collectively dictate the final price at the pump.
The Lifecycle Timeline: Well to Pump
1. Extraction
Timeline: Days to Months
Crude oil is located, drilled, and pumped from onshore or offshore wells. It is then gathered and stored before being sold on the global market and shipped to refineries.
2. Refining
Timeline: 2 to 3 Weeks
Crude arrives via pipeline or supertanker. Refineries use immense heat and pressure to boil and "crack" the complex hydrocarbons into usable products like gasoline, diesel, and jet fuel.
3. Distribution
Timeline: 1 to 2 Weeks
Refined gasoline is pushed through massive underground pipelines to regional storage terminals. Here, it is blended with ethanol and specific detergent additives required by law or brand standards.
4. Retail
Timeline: 1 to 3 Days
Tanker trucks load the finished, branded gasoline at the terminal and deliver it to local gas stations, where it sits in underground storage tanks waiting for your vehicle.
Upstream Economics: Crude Oil Exploration and Extraction
The Geology and Capital Cost of Shale Extraction
The physical lifecycle of gasoline begins at the wellhead. The United States currently stands as the world's largest producer of crude oil, a position achieved and maintained predominantly through the deployment of hydraulic fracturing and horizontal drilling technologies in tight shale formations. The primary engines of domestic crude production include the Permian Basin in West Texas and New Mexico, the Eagle Ford Shale in South Texas, and the Bakken Formation in North Dakota.
The capital required to extract crude oil from these formations is substantial, presenting a high barrier to entry that varies significantly depending on the geological characteristics, depth, and pressure of the specific play. In 2026, the estimated capital expenditure required to drill and complete a single shale well in the highly prolific Permian Delaware or Permian Midland basins ranges between $9 million and $10 million. Wells situated in the Uinta, Williston, and Anadarko basins require slightly lower capital expenditures, generally ranging from $8 million to $9 million per well. Conversely, shallower or less geologically complex plays, such as the Denver Julesburg basin or certain Alberta formations, demonstrate significantly lower capital requirements, ranging from $2 million to $6.5 million per well.
Despite these massive initial capital expenditures, the upstream exploration and production sector has achieved remarkable efficiency gains over the past decade. The technological capability to locate precise hydrocarbon reserves and execute multi-pad drilling, where a single drilling rig is repositioned mere yards to drill multiple adjacent horizontal laterals, has drastically reduced the incidence of dry holes and fundamentally lowered the breakeven cost of shale production. These efficiency metrics are critical to the broader gasoline market because they dictate the resilience of domestic crude supply against global price volatility.
For instance, throughout late 2025 and early 2026, the active rig count in the United States fell by roughly a third, with the Permian Basin's active rig count dropping to approximately 250 rigs. Despite this contraction in physical drilling hardware, domestic supply remained near record highs. This counterintuitive dynamic is driven by a steady rise in the number of wells drilled per active rig and the application of enhanced completion techniques, such as microfracturing, diverting agents, and coil-tipping fracks.
The primary threat to sustained, long-term production growth in maturing shale plays is the phenomenon of parent-child well interference. As operators drill newer child wells in tighter spacing proximity to older parent wells, the overall reservoir pressure is depleted, leading to degraded performance and lower ultimate hydrocarbon recovery. To mitigate this geological risk, exploration and production companies have shifted their strategic focus away from rapid, debt-fueled volume growth. Instead, they have adopted disciplined capital management strategies, prioritizing free cash flow generation and shareholder returns over sheer output growth. Analysts characterize this current era of the Permian Basin as a measured phase, transitioning from rapid expansion to sustained, highly optimized plateau production.
Global Pricing Vulnerabilities and Supply Scenarios
Because crude oil acts as a globally traded commodity, domestic producers act as price takers rather than price makers. The baseline price of West Texas Intermediate (WTI) or Brent crude is determined by international supply and demand balances, heavily influenced by the production targets of the Organization of the Petroleum Exporting Countries (OPEC), led by Saudi Arabia, as well as broader geopolitical stability.
The vulnerability of the U.S. shale industry to these global pricing vulnerabilities is a critical factor in the long-term forecasting of gasoline prices. Market analysts continually model production scenarios based on prevailing WTI prices. When WTI prices hover near $60 per barrel, U.S. crude and condensate supply demonstrates exceptional resilience, supported by the aforementioned drilling efficiencies. However, if global macroeconomic conditions or OPEC interventions force WTI prices into a sustained $50 per barrel scenario, the U.S. supply chain becomes severely compromised. Under a prolonged $50 per barrel price environment, models project that the U.S. active rig count could plummet to 360 nationally, which would slash U.S. crude supply by up to 700,000 barrels per day by the fourth quarter of 2026 as the natural decline rates of existing shale wells outpace new completions.
This underlying sensitivity means that while the U.S. produces massive volumes of oil, the retail price of gasoline remains inextricably linked to the global clearing price of crude. The cost to produce a barrel varies wildly on a global scale, from roughly $20 per barrel in the deserts of Saudi Arabia to upwards of $90 per barrel for complex deep-water oceanic wells. Domestic gasoline prices must inherently reflect this global average acquisition cost.
Upstream Corporate Profitability and Financial Resilience
The financial performance of the integrated oil majors provides a clear, empirical lens into upstream profitability and its relationship to the gasoline market. Following the severe price shocks and volatility of 2022, major integrated energy companies restructured their operations to maximize free cash flow and lower their breakeven points, ensuring profitability even in lower-price environments.
For the full year 2025, ExxonMobil reported net earnings of $28.8 billion. While this represented a 15% decline from the prior year's $33.7 billion, driven by weaker crude prices, lower chemical margins, and $1.7 billion in asset-impairment charges, it still represented near-record historical profitability. A significant driver of this sustained profitability is the aggressive pursuit of structural cost reductions. Since 2019, ExxonMobil has achieved $15.1 billion in cumulative structural cost savings, and the corporation recently updated its corporate plan to target $20 billion in cumulative savings by 2030.
This highly disciplined operational approach allows the major producers to partially decouple their earnings from a direct, one-to-one correlation with spot crude prices. For example, in the fourth quarter of 2025, Chevron reported an average Brent crude realization of $64 per barrel, a steep decline from the $75 per barrel received a year earlier. Yet, despite this 14% drop in the underlying commodity price, Chevron still managed to post record full-year production of 3.72 million barrels of oil equivalent per day (BOE/d) and generated a record full-year operating cash flow of $33.90 billion. Volume growth and operational efficiency completely offset price weakness. The upstream segment typically accounts for the vast majority of these integrated companies' earnings; between 2021 and 2025, Chevron generated between 74% and 92% of its total earnings exclusively from its upstream exploration and production segment.
This robust financial performance is mirrored across the international upstream sector. In the third quarter of 2025 alone, Shell reported adjusted earnings of $5.43 billion, Equinor delivered a net operating income of $5.27 billion, and Canadian operators like Cenovus Energy generated $2.1 billion in cash from operating activities fueled by record upstream production of 832,900 BOE/d. Over the last three years, the upstream shale sector's net income has cumulatively exceeded $50 billion, allowing companies to maintain capital expenditures at high levels while simultaneously driving net debt to its lowest points since 2016.
| Metric | ExxonMobil (Full Year 2025) | Chevron (Full Year 2025) | Shell (Q3 2025) | Cenovus Energy (Q3 2025) |
|---|---|---|---|---|
| Net Income / Adjusted Earnings | $28.8 Billion | Record Operating Cash Flow ($33.90B) | $5.43 Billion (Adjusted) | $2.1 Billion (Operating Cash) |
| Upstream Production Volume | ~5.0 Million BOE/d | 3.72 Million BOE/d | N/A | 832,900 BOE/d |
| Capital Expenditures | $29.0 Billion | N/A | N/A | N/A |
| Structural Cost Savings | $15.1 Billion (cumulative since 2019) | $3.0 - $4.0 Billion (target) | N/A | N/A |
These massive upstream profits often attract public scrutiny when retail gasoline prices rise. However, the upstream producer's margin is locked in at the point the crude oil is sold into the global market. When geopolitical shocks occur, such as the escalation of conflict in the Middle East in early 2026, global crude prices can spike instantly. Because the upstream producer's extraction costs are relatively fixed, any rapid escalation in the global price of Brent or WTI crude instantly expands the producer's net profit per barrel.
Midstream Transit: Moving Crude to the Refinery
Once extracted from the earth, crude oil must be transported to specialized processing facilities. Crude oil is not a uniform substance; it varies significantly in its chemical composition, density, and sulfur content, ranging from light, sweet grades to heavy, sour grades. Consequently, specific batches of crude oil must be directed to specific refineries that are technologically optimized to process those particular hydrocarbon profiles.
The initial transit from the remote wellhead often involves gathering pipelines or tanker trucks moving the raw crude to bulk unloading stations and regional storage tanks. From these initial aggregation points, long-haul pipelines serve as the dominant, most economically efficient mode of midstream transit. For major producing basins, these pipeline networks are vast and critical. For example, the EPIC crude oil pipeline stretches 730 miles from the Permian Basin and Eagle Ford Shale directly to refinery and export hubs in Corpus Christi, Texas, possessing a throughput capacity of 590,000 barrels per day.
Midstream pipeline companies operate on a highly distinct business model compared to their upstream counterparts. Rather than taking ownership of the commodity and absorbing price risk, midstream operators function primarily as toll collectors. They operate on a fee-based model, charging regulated tariffs for volumetric throughput, which provides them with highly stable, predictable profit margins that are largely insulated from the direct volatility of crude oil commodity prices.
The profitability of the midstream sector in 2025 and 2026 reflects this steady, volume-driven growth. For instance, Infinity Natural Resources reported a 104% growth in Adjusted EBITDAX to $94.0 million in the fourth quarter of 2025, representing a highly lucrative margin of $3.76 per thousand cubic feet equivalent. Similarly, Summit Midstream Corporation reported average daily natural gas throughput on its operated systems of 925 million cubic feet per day in the third quarter of 2025, generating reliable price-driven segment revenues. Hess Midstream projected its full-year 2026 Adjusted EBITDA to land between $1.225 billion and $1.275 billion, targeting a massive Gross Adjusted EBITDA Margin of approximately 75% based on gathering volumes of 115,000 to 125,000 barrels of crude oil per day.
The physical transit time for crude oil from the wellhead to the refinery gates generally takes only a few days via pipeline. However, the oil may sit in massive storage terminals, such as the vital delivery hub in Cushing, Oklahoma, for extended periods, waiting for advantageous market pricing conditions or available refinery processing capacity.
The Refining Process: Chemical Transformation, Timelines, and Margins
The Science and Chronology of Refining
Upon arriving at the refinery, crude oil enters a highly complex, sprawling industrial ecosystem designed to break down long-chain hydrocarbons into usable, valuable distillates. A petroleum refinery functions essentially as a giant, continuous chemistry set, utilizing immense heat, pressure, and chemical catalysts to alter molecular structures.
The crude oil is first routed through a high-temperature furnace, ultra-heating the liquid until the majority of it vaporizes into a gas. This superheated mixture then enters an atmospheric distillation tower. Inside this massive vertical column, the liquids and vapors separate into different streams, or fractions, based entirely on their differing boiling points. Heavy, viscous liquids with high boiling points settle at the bottom of the tower, eventually becoming asphalt base or heavy fuel oils. Meanwhile, lighter streams, such as naphtha, kerosene, and gasoline vapors, rise to the top of the tower, where they boil and condense at lower temperatures and are subsequently collected.
These raw outputs, however, are rarely ready for market and require extensive secondary processing. Reformer units are utilized to convert lower-octane naphtha into higher-octane gasoline components through chemical reactions. Fluid catalytic crackers (FCC units) are employed to break down heavier, less valuable gas oils into lighter, more profitable fuels like gasoline and diesel.
The chronological progress of a batch of crude oil through a refinery is tracked meticulously by the hour. Generally, a standard 30,000-barrel batch takes between 12 to 24 hours to undergo this entire sequence of thermal heating, catalytic separation, analytical testing, and rigorous quality control. However, refineries maintain significant on-site stockpiles to ensure continuous operation against supply chain disruptions.
A unique and economically vital dynamic of the refining process is the processing gain. Because the refined products have a lower physical density than the raw crude oil from which they are derived, the total volume of output actually exceeds the volume of input. In 2023, the average processing gain at U.S. refineries was approximately 6.3%. This means that a standard 42-gallon barrel of crude oil yields slightly more than 42 gallons of refined petroleum products, providing a volumetric margin benefit to the refiner.
Refinery Yield from a 42-Gallon Barrel
The Refining Process: Boiling It Down
Refineries don't just produce gasoline. When a standard 42-gallon barrel of crude oil is processed, it actually yields about 45 gallons of petroleum products due to a phenomenon called "processing gain" (the resulting products have a lower density and greater volume than the original crude).
Gasoline represents the largest slice of this yield, but refineries must carefully balance their output of diesel, jet fuel, and base materials for plastics to remain profitable across all sectors of the economy.
Operational Expenditures and the Hidden Energy Intensity of Gasoline
Refining is a staggeringly energy-intensive industrial endeavor. The operating costs of a refinery include specialized labor, continuous mechanical maintenance, expensive chemical catalysts, and massive amounts of electrical power and thermal energy.
To successfully refine a single gallon of gasoline, a facility consumes an average of 6 kilowatt-hours (kWh) of energy equivalent, utilizing a combination of electrical grid power and on-site natural gas combustion. This energy consumption metric highlights a profound and often overlooked irony in the transportation sector: 6 kWh is roughly the exact amount of electricity required to propel an average modern electric vehicle (EV) 20 to 25 miles. Therefore, the energy wasted simply preparing a gallon of gasoline for combustion is equivalent to the total energy required to drive a competing EV the same distance.
Because refineries rely heavily on the broader electrical grid and natural gas markets to power their distillation columns, the cost of refining is indirectly tethered to natural gas prices. Generating one kWh of electricity conventionally requires the consumption of approximately 7.42 cubic feet of natural gas or 1.14 pounds of coal. If natural gas prices spike, the cost of electricity generation increases, subsequently driving up the refinery's baseload operating expenses.
The aggregate cost to physically refine a gallon of gasoline fluctuates between $0.40 and $0.70, heavily dependent on seasonal environmental regulations and product specifications. Summer-blend gasoline, which is federally mandated to feature lower vaporization rates to mitigate smog and ozone pollution in warmer ambient temperatures, requires more expensive blending components and longer processing times, pushing refining costs toward the higher end of the spectrum. Furthermore, the production of premium higher-octane fuels requires more severe reforming and chemical inputs, which directly elevates manufacturing costs. The price differential between regular and premium gasoline has expanded significantly over the past decade; by 2023, the national average price for premium-grade gasoline was about 85 cents per gallon higher than regular-grade.
The Crack Spread and Refiner Profitability
Refiners, much like upstream crude producers, do not unilaterally dictate the retail price of their finished products. They are price takers operating within a massive global market, selling their gasoline and diesel at wholesale spot prices determined by international supply and demand. The U.S. alone consumes 16.6 million barrels of crude and 850 million gallons of refined products every single day, making it impossible for any single facility to control the market.
The profitability of a refinery is mathematically measured by the crack spread, the differential between the purchase price of the crude oil feedstock and the wholesale selling price of the refined products. The industry standard metric is the 3:2:1 crack spread, which assumes that three barrels of crude oil are processed to produce two barrels of gasoline and one barrel of diesel.
In periods of market distress, geopolitical tension, or localized supply constraints, crack spreads can expand rapidly, delivering massive financial windfalls to refiners. For example, during the escalation of Middle Eastern geopolitical tensions in early March 2026, the 3-2-1 crack spread jumped vertically from $28.55 to $44.33 in a matter of days. This indicates that the wholesale price of gasoline and diesel on the commodity markets rose much faster than the underlying cost of crude oil. Consequently, refiners padded their profit margins significantly, demonstrating that sudden increases in pump prices during an international crisis often reflect opportunistic margin expansion rather than a pure, one-to-one pass-through of crude oil costs.
Over the forecast period spanning 2025 to 2026, the EIA and private analysts project that U.S. gasoline and diesel refining margins will structurally strengthen. This is primarily due to a net loss of U.S. refining capacity following the permanent closure of several aging facilities during the pandemic and subsequent years. As overall crude oil prices decline, refiners are expected to capture a larger percentage of the final retail price. Forecasts indicate the average diesel crack spread is expected to jump from $0.52 per gallon in 2024 to $0.84 per gallon by 2026, with gasoline refining margins mirroring this upward trajectory.
Corporate earnings reflect this operational leverage. Marathon Petroleum, a major U.S. refiner, reported a full-year net income of $4.0 billion for 2025, supported by an astonishing 94% utilization rate across its refineries and a 105% margin capture rate. This level of utilization indicates that plants are running at absolute maximum reliable capacity, producing higher volumes of finished product at highly favorable market margins, ultimately generating $8.3 billion in cash from operations.
The California Micro-Climate: Isolation and SB 1322 Transparency
The California fuel market presents a unique and highly constrained micro-climate for refining economics. Due to its geographical isolation from the Gulf Coast pipeline network and its uniquely strict environmental fuel mandates, the state relies entirely on a consolidated network of in-state refiners and ocean-borne imports. Following the closure of Phillips 66's Los Angeles refinery, the top four firms controlled a staggering 98% of California's in-state refining capacity.
To combat perceived price gouging within this oligopoly, California enacted the Oil Refinery Cost Disclosure Act (Senate Bill 1322), which legally mandates that refiners publicly report their gross and net margins. A review of these disclosures for California refiners shows that they maintained average annual gross refining margins of $1.01 per gallon in 2023, $0.70 per gallon in 2024, and $0.75 per gallon in 2025.
The gross gasoline refining margin is calculated by subtracting the crude oil acquisition cost from the wholesale gasoline price. For instance, aggregated SB 1322 data from December 2025 demonstrated that refiners acquired domestic crude at $1.52 per gallon and foreign crude at $1.53 per gallon. They subsequently sold unbranded rack wholesale gasoline at $1.77 per gallon, branded rack at $2.10 per gallon, and Dealer Tankwagon (DTW) sales at $2.34 per gallon. The massive spread between the $1.53 acquisition cost and the $2.34 DTW sale price encapsulates both the operational expense of running the refinery and the sheer net profit extracted by the refiner.
Downstream Distribution: Pipelines, Terminals, and Blending
Long-Haul Pipeline Transit of Blendstock
It is a common misconception that refineries produce retail-ready gasoline. In reality, refineries produce a fungible, unfinished commodity known as gasoline blendstock, which must be transported to regional distribution terminals for final blending. The most efficient, secure, and cost-effective method for this massive secondary distribution is long-haul pipeline transit.
The Colonial Pipeline serves as the quintessential example of downstream logistics infrastructure. Spanning 5,500 miles, the system links more than two dozen major Gulf Coast refineries to markets across the Southeast, the Mid-Atlantic, and the Eastern Seaboard, terminating in Linden, New Jersey. The system is the largest refined products pipeline by volume in the United States, pushing over 100 million gallons of refined fuel every single day and supplying nearly 45% of the East Coast's entire fuel consumption.
The physics of pipeline transit dictates a slow, deliberate pace. Products flow through the main lines at a rate of 3 to 5 miles per hour. As a result, the physical journey of a specific batch of gasoline blendstock from Houston, Texas, to the New York Harbor takes between 14 and 24 days, with an average transit time of exactly 18.5 days. To buffer against this long lead time, the fifteen associated oil terminals along the route store more than 1.2 billion gallons of fuel, providing a critical 45-day supply buffer for local communities.
Shippers pay a local rate tariff to move their product through the pipeline system. These tariffs are heavily regulated by the Federal Energy Regulatory Commission (FERC) and vary based on the specific route and volume tier. A tariff filing effective in 2026 indicated rates of approximately 25.95 cents per barrel for specific segmented routes out of Port Arthur, Texas. Pipeline operators frequently update their tariffs and minimum batch requirements to optimize flow dynamics and maximize revenue. In April 2025, Colonial Pipeline implemented a tariff change that increased the minimum volume threshold for conventional gasoline shipments. Upstream of Meridian, Mississippi, batches must now meet a 50,000-barrel minimum, while fungible batches downstream must be at least 75,000 barrels. This consolidation was necessary because shipments of M grade had dropped by 77% since 2015, and V grade had fallen 90%; smaller, irregular batches risked slowing flow rates and causing disruptions.
Terminal Blending: Ethanol and Detergents
Upon reaching regional distribution terminals, the unfinished gasoline blendstock undergoes final preparation. First, the blendstock is mixed with oxygenates, primarily corn-based fuel ethanol. Since the implementation of the Renewable Fuel Standard, ethanol is blended into almost all U.S. gasoline, typically constituting 10% of the final retail volume. Because ethanol is often cheaper than the hydrocarbon blendstock, its inclusion can marginally lower the aggregate cost of the fuel; models suggest ethanol blending can reduce the expected price of retail gasoline by several cents per gallon.
Following oxygenation, proprietary detergent packages are injected into the fuel. These detergents are federally mandated to prevent the buildup of carbon deposits in engines, and different retail brands utilize specific, closely guarded chemical additive packages to differentiate their products. These additives introduce a fractional but necessary cost; bulk detergent additives can cost approximately $0.0225 per additive gallon, translating to an embedded cost fraction in every single retail gallon loaded onto a delivery truck.
The Last Mile: Trucking Logistics and Distribution Costs
Once fully blended, the finished motor gasoline is loaded into heavy-duty Class 8 tanker trucks for the last mile delivery from the terminal rack to individual retail gas stations. This final leg of the journey usually takes 12 hours or less, but it is surprisingly expensive and highly sensitive to external macroeconomic pressures, specifically the cost of commercial diesel fuel and complex transportation tax structures.
Operating a commercial tanker truck is capital intensive. In 2026, the total operating cost for a fully loaded owner-operator semi-truck ranges between $1.70 and $2.10 per mile, even before accounting for major maintenance and tire degradation. Fuel represents the single largest variable expense, accounting for roughly 20% to 25% of a trucking carrier's total operating budget. Because a standard fully loaded tanker truck achieves a dismal fuel efficiency of only 6.5 to 7.0 miles per gallon, any surge in diesel prices directly and severely inflates the cost of delivering gasoline.
This vulnerability was exposed acutely in March 2026, when conflict in the Middle East caused the national average cost of diesel to spike by nearly 86 cents in a single week, reaching an average of $4.599 to $4.78 per gallon. At these prices, the pure fuel cost to operate a semi-truck surged to roughly $0.54 to $0.59 per mile. For the driver, the sheer cost to fill a 100-gallon rig topped $642. To protect their margins from ruin, logistics companies do not absorb these costs; instead, they pass them directly onto gasoline distributors via complex, dynamic fuel surcharges. These surcharges are contractually tied to the Department of Energy's weekly average diesel price, ensuring that when diesel prices rise, the distribution and marketing cost component of every gallon of retail gasoline rises in tandem.
Furthermore, the trucking industry bears a disproportionate burden of physical transportation taxes, which are ultimately subsidized by the gasoline consumer. Heavy-duty trucks operating in interstate commerce must pay the federal diesel tax of 24.4 cents per gallon, plus varying state diesel taxes. When combined, these federal and state diesel fuel taxes often total 55 to 65 cents per gallon. When this tax burden is factored into the vehicle's 6.5 mpg fuel economy, taxes alone quietly add about 9 to 15 cents of operational cost to every single mile the tanker truck drives. For a truck running 100,000 miles a year, that equates to $15,000 annually in taxes and regulatory fees, a massive overhead cost that must be recouped in the final retail markup of the gasoline being delivered.
Retail Economics: The Station at the Pump
The final node in the gasoline supply chain is the retail gas station. A persistent, widespread macroeconomic myth among consumers is that independent gas station owners reap massive financial windfalls when retail prices surge. In reality, the retail fuel market is intensely competitive, hyper-localized, and fuel is frequently utilized merely as a low-margin loss leader designed explicitly to drive foot traffic into the accompanying convenience store.
Gross Markup Versus Net Margin
The average gross markup on a gallon of gasoline at the retail level has hovered around 35 to 40 cents over the past five years. However, this gross markup is quickly decimated by the station's extensive fixed and variable operating costs. The retailer must pay franchise fees, real estate rent, employee wages, high utility costs, environmental compliance fees, equipment maintenance for the pumps and underground storage tanks, and massive insurance premiums.
Once these heavy overhead expenses are deducted from the 35-cent gross markup, the actual net profit margin for an independent gas station owner is razor-thin, generally falling well under 2%. This equates to a net profit of approximately 10 to 15 cents per gallon before taxes. Even major, scaled corporate operators face these exact same constraints; massive retail conglomerates like Alimentation Couche-Tard report gross margins of just over $0.47 per gallon, which is subsequently heavily diluted by enterprise-level operating expenses.
Because fuel margins are so severely constrained, true retail profitability is overwhelmingly dependent on inside sales. Financial projections and models for gas station operators in 2026 indicate that while gasoline sales generate massive top-line revenue volume, it is the convenience store sales, which boast net profit margins upwards of 10%, that generate the vast majority of the actual profit. In a standard scenario, gasoline sales might account for only 32% of a station's net profits, while the convenience store sales account for the remaining 68%. By combining the profits from both sides of the business, a successful station might achieve an overall net profit margin of roughly 3.7%. Therefore, modern gas station operators must focus intensely on conversion rates, attempting to turn 65% of fuel-only customers into in-store purchasers of high-margin items like prepared food, coffee, and snacks.
The Hidden Attrition of Credit Card Interchange Fees
A hidden but highly destructive variable cost eating into retail fuel margins is the credit card interchange fee. When a consumer purchases fuel at the pump with a Visa or Mastercard, the payment network levies a percentage-based processing fee on the total transaction amount. Because the fee is a percentage of the total sale rather than a fixed rate per gallon, the station's cost increases linearly as gasoline prices rise.
For example, when gas averages $3.50 per gallon, credit card fees average approximately 8.4 cents per gallon. If macroeconomic factors force gas prices up to $4.50 per gallon, the percentage-based fee expands proportionally, consuming an even larger fraction of the station's static 10 to 15-cent net profit. Following a major 2013 legal settlement, merchants are legally permitted to assess a surcharge on customers who pay with credit cards to recoup these network fees. However, the compliance rules governing these surcharges are highly burdensome, requiring complex signage and receipt disclosures. Furthermore, several states outright ban credit card surcharging as of 2024.
As a pragmatic workaround, the vast majority of independent gas stations simply offer a cash discount, typically 5 to 10 cents off per gallon, incentivizing consumers to bypass the credit networks entirely. This dual-pricing model is unique to gas stations because they sell one highly visible primary product, making it easy to price the commodity differently based on the payment method to preserve their fragile net profit margin.
Following the Money: Who Actually Profits?
A common misconception is that local gas stations are gouging consumers when prices spike. In reality, the profit margins shift drastically depending on where you look in the supply chain. Upstream producers take the most risk and reap the highest variable rewards, while local stations make pennies on the fuel, relying instead on convenience store sales to survive.
The Role of Taxation: The Fixed Floor of Gasoline Prices
Before a consumer ever pulls the trigger on a fuel nozzle, a massive portion of the displayed price has already been claimed by federal, state, and local government entities. Taxes represent a rigid, fixed-cost floor under the price of gasoline, completely agnostic to the underlying cost of crude oil or refining. In 2023, taxes accounted for 14.4% of the average retail price of a gallon of gasoline.
The Tax Burden
Taxes represent a significant, non-negotiable portion of fuel costs. The federal excise tax on gasoline has remained static at 18.4 cents per gallon since 1993, funding the Highway Trust Fund.
State taxes, however, vary wildly. From relatively low rates in states like Alaska to heavy levies in California and Pennsylvania, state-level legislation drastically alters the final pump price depending on where you live. These funds typically support local infrastructure and environmental programs.
Average Excise Taxes (Cents per Gallon)
The tax burden is bifurcated into federal and state levies. The federal excise tax on motor gasoline is 18.4 cents per gallon, comprising an 18.3-cent core excise tax and a 0.1-cent federal Leaking Underground Storage Tank (LUST) fee. For diesel fuel, the federal tax is 24.4 cents per gallon. Notably, this federal gasoline tax rate has remained entirely unchanged since October 1993, steadily losing its purchasing power to three decades of inflation.
Conversely, state taxes are highly variable, frequently legislatively adjusted, and create stark geographic disparities in retail pricing across state lines. The EIA compiles this data bi-annually. As of January 1, 2026, state taxes and fees on motor gasoline averaged 33.3 cents per gallon nationally. Between 2025 and 2026, 26 states altered their gasoline taxes, with 19 states raising them and 7 lowering them. Notable adjustments included Washington state increasing its tax by 6.2 cents per gallon and Michigan increasing by 5.2 cents per gallon.
The variance between jurisdictions is immense, fundamentally altering the baseline cost of fuel depending on geography. The following table highlights the severe disparity in combined tax burdens across a selection of representative states as of early 2026:
| State | State Excise Tax & Fees (per gal) | Federal Tax (per gal) | Total Baseline Tax Burden |
|---|---|---|---|
| California | $0.709 | $0.184 | $0.893 |
| Pennsylvania | $0.576 | $0.184 | $0.760 |
| Washington | $0.494 | $0.184 | $0.678 |
| Texas | $0.200 | $0.184 | $0.384 |
| Alaska | $0.090 | $0.184 | $0.274 |
Note: Certain states, such as California, Illinois, and Michigan, apply additional percentage-based sales taxes on top of these flat excise taxes.
Shadow Taxes and Environmental Compliance
In highly regulated markets like California, the governmental burden extends far beyond traditional excise taxes. Wholesale gasoline prices in California embed the hidden costs of mandatory compliance with the state's Low Carbon Fuel Standard (LCFS) and Cap-and-Trade environmental programs.
These environmental mandates function as shadow taxes, passed seamlessly down the supply chain from the refiner to the wholesale rack, and ultimately to the retail pump. Recent disclosure data from December 2025 explicitly quantified these burdens: for unbranded rack sales, LCFS compliance added roughly $0.14 per gallon, and Cap-and-Trade compliance added $0.24 per gallon to wholesale costs. Looking forward, academic models from UC Davis predict that if carbon allowance prices hit the legislative price ceiling of approximately $135 by 2030, Cap-and-Trade compliance alone would contribute a staggering $1.21 per gallon to California gasoline prices.
Macroeconomic Forces and Geopolitical Forecasting (2026-2027)
The final, overarching variable dictating the price of a gallon of gasoline is the volatile macroeconomic and geopolitical environment. Because crude oil and finished gasoline are globally traded, highly liquid commodities, local U.S. retail prices are instantly vulnerable to international shocks and systemic supply chain disruptions.
This vulnerability was starkly demonstrated in early March 2026. The national average for a gallon of regular gasoline jumped nearly 27 cents in a single week to $3.25. This massive price shock was not driven by domestic supply issues, but entirely by escalating military conflict in the Middle East involving the U.S. and Iran. The perceived threat to the Strait of Hormuz, a vital global shipping choke point for petroleum, sent crude oil prices surging higher into the mid-$70 per barrel range. The mere threat of prolonged supply disruptions forced commodity traders to aggressively bid up the price of oil futures, instantly raising the wholesale acquisition cost for domestic refineries. Refiners subsequently passed these elevated costs down the pipeline to distribution terminals, forcing retail stations to hike pump prices to preserve their 2% margins.
These acute volatility spikes constantly force federal agencies to revise their long-term economic models. Prior to the March 2026 conflict, the EIA's Short-Term Energy Outlook (STEO) had originally forecast that the annual retail gasoline price would average $2.91 per gallon in 2026, representing a decrease from the 2025 average of $3.10 per gallon. However, following the Middle East supply shock, the EIA was forced to drastically revise its projections. The March STEO updated the 2026 forecast, raising the expected annual average retail gasoline price by 14.7% to $3.34 per gallon, and raising the retail diesel price forecast by 20.1% to $4.12 per gallon.
| Forecast Year | Previous EIA Retail Gasoline Forecast | Revised EIA Retail Gasoline Forecast | Percentage Change |
|---|---|---|---|
| 2026 | $2.91 / gallon | $3.34 / gallon | + 14.7% |
| 2027 | $2.93 / gallon | $3.18 / gallon | + 8.4% |
Despite these short-term geopolitical shocks, the broader, long-term macroeconomic forecast for the remainder of the decade suggests structural downward pressure on domestic gasoline consumption, fighting against upward pressure from refining constraints. The EIA projects that global increases in crude oil supply will ultimately outpace demand growth, leading to lower crude acquisition costs. Simultaneously, domestic gasoline consumption is expected to decrease structurally due to increasing fleetwide fuel economy standards and the accelerating market penetration of electric vehicles.
However, this systemic reduction in consumer demand is being aggressively counterbalanced by the aforementioned contraction in domestic refining capacity. As older, less efficient refineries are permanently decommissioned, the remaining operational facilities control a larger share of the market, allowing them to command higher crack spreads and thicker profit margins. Therefore, even if the underlying cost of crude oil falls through 2027, the refining, terminal blending, trucking distribution, and taxation components of the retail price are capturing a proportionately larger, stickier share of the consumer's dollar.
Conclusion
The lifecycle of a single gallon of U.S. gasoline is a masterclass in global logistics, advanced chemical engineering, and raw commodity economics. When a driver dispenses fuel at a local retail station, they are purchasing a highly engineered liquid that began its journey between two to four weeks prior as crude oil trapped miles beneath layers of prehistoric shale.
The timeline of this supply chain is astonishingly precise and unyielding. Upstream extraction from horizontal wells is rapid; initial pipeline transit from the wellhead to the refinery storage tanks takes merely days. The intense thermal and chemical transformation inside the refinery requires an exact 12 to 24 hours of continuous processing. The transit of the finished blendstock via major arteries like the 5,500-mile Colonial Pipeline consumes an average of 18.5 days. Finally, the last-mile localized distribution via heavy-duty tanker trucks takes mere hours.
Economically, the final retail price displayed on the pump is the aggregate mathematical result of immense capital expenditures, fluctuating global commodity markets, and heavily layered taxation. Upstream producers invest upwards of $10 million per well, leveraging structural cost efficiencies to generate billions in free cash flow regardless of price swings. Downstream refiners consume massive amounts of electrical grid energy, utilizing volatile crack spreads to pad margins during times of geopolitical supply constraint. Midstream pipeline operators and downstream trucking companies extract fixed-fee tariffs and dynamic fuel surcharges to meticulously insulate themselves from diesel inflation. And before the retailer is allowed to capture a marginal 1% to 2% net profit, federal and state government entities seamlessly collect between 10% and 25% of the total retail price in fixed excise and environmental taxes.
Understanding this intricate, interconnected supply chain dispels the simplistic notion of arbitrary price-setting at the pump. The cost of a gallon of gasoline is not determined by the local station owner, but rather by the aggregate sum of global geology, international geopolitical stability, industrial chemistry, Wall Street commodity trading, and localized tax policy, all intersecting flawlessly at the point of sale.
Streamline Your Energy Workforce
Managing the complex labor requirements of the crude oil supply chain and gasoline refining processes requires precision. Discover how our industry-specific solutions can help.
Explore TimeTrex for Oil & GasDisclaimer: The content provided on this webpage is for informational purposes only and is not intended to be a substitute for professional advice. While we strive to ensure the accuracy and timeliness of the information presented here, the details may change over time or vary in different jurisdictions. Therefore, we do not guarantee the completeness, reliability, or absolute accuracy of this information. The information on this page should not be used as a basis for making legal, financial, or any other key decisions. We strongly advise consulting with a qualified professional or expert in the relevant field for specific advice, guidance, or services. By using this webpage, you acknowledge that the information is offered “as is” and that we are not liable for any errors, omissions, or inaccuracies in the content, nor for any actions taken based on the information provided. We shall not be held liable for any direct, indirect, incidental, consequential, or punitive damages arising out of your access to, use of, or reliance on any content on this page.
Trusted By
Trusted by 3.4M+ Employees: 23 Years of Service Across Startups to Fortune 500 Enterprises
Join our ever-growing community of satisfied customers today and experience the unparalleled benefits of TimeTrex.


Strength In Numbers
Join The Companies Already Benefiting From TimeTrex
Time To Clock-In
Start your 30-day free trial!
Experience the Ultimate Workforce Solution and Revolutionize Your Business Today
- Eliminate Errors
- Simple & Easy To Use
- Real-time Reporting

Saving businesses time and money through better workforce management since 2003.
Copyright © 2026 TimeTrex. All Rights Reserved.