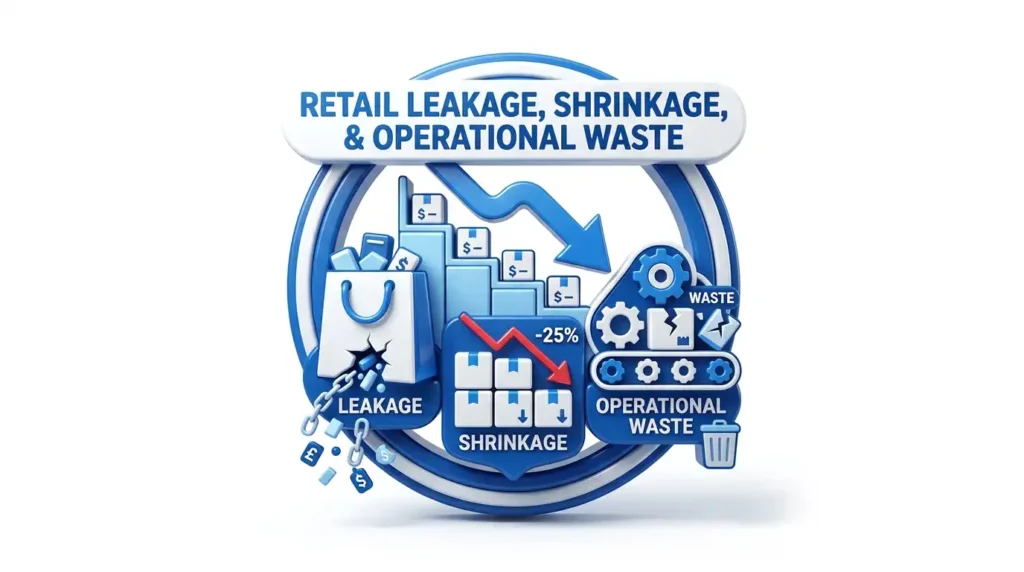

Retail Leakage, Shrinkage, and Operational Waste
- The Paradigm Shift in Retail Profit Preservation
- The Eight Deadly Wastes of Retail Operations
- Physical Shrinkage and Digital Inventory Distortion
- Perishable Spoilage and Supply Chain Waste
- Administrative Vulnerabilities and Internal Subversion
- The Human Capital Drain: Payroll, Labor Mismanagement, and Time Theft
- Post-Sale Revenue Erasure: Returns, Wardrobing, and Markdown Mismanagement
- Value Chain, Technology, and Infrastructure Vulnerabilities
- Conclusions and Strategic Imperatives
The Paradigm Shift in Retail Profit Preservation
For decades, the retail sector evaluated asset protection and profit preservation through the narrow, highly localized lens of physical inventory shrinkage. Historically defined as the simple delta between recorded inventory and actual physical counts, shrinkage was treated as a monolithic, unavoidable cost of doing business. However, as the complexities of the modern omnichannel retail environment have multiplied, this traditional framework has proven dangerously inadequate. The contemporary retail enterprise does not merely lose money when merchandise is physically stolen from a sales floor; it hemorrhages capital through a vast, interconnected web of administrative errors, systemic workflow inefficiencies, workforce mismanagement, digital vulnerabilities, and vendor exploitation.
This realization has driven the industry toward a much more comprehensive analytical framework known as Total Retail Loss (TRL). Introduced in 2016 by Professor Adrian Beck and the ECR Retail Loss Group, TRL fundamentally redefines the concept of profit erosion. The framework posits that true retail losses encompass any events and outcomes that negatively impact profitability and make no positive, identifiable, or intrinsic contribution to generating income. By expanding the taxonomy of loss from a handful of inventory metrics to upwards of 42 distinct categories (ranging from shop theft and supply chain errors to corporate headquarters fraud and e-commerce abuse), TRL forces retail organizations to dismantle their operational silos.
The Big Picture: Anatomy of Retail Shrink
While high-profile organized retail crime dominates headlines, a massive portion of the $100 Billion annual retail loss is internal and systemic. "Leakage" refers to value lost through administrative errors, operational inefficiencies, and process breakdowns. The data below reveals that non-malicious errors and internal mismanagement account for a devastatingly large slice of the shrinkage pie.
Administrative Loss is Underestimated
Nearly 27% of all retail shrinkage is purely administrative. This includes paperwork errors, mis-ticketing, systems integration failures, and critically, payroll discrepancies. Unlike shoplifting, these losses are completely within the retailer's control to fix, yet they silently erode profit margins year after year.
Paperwork & Admin
The distinction between the "costs" of operating a retail business and actual "losses" serves as a critical inflection point in enterprise financial strategy. A cost is a necessary expenditure designed to generate revenue, such as marketing, facility leasing, or basic labor. A loss, conversely, is a capital drain that yields zero return. Under the TRL methodology, losses must be measured in a manner that is manageable and manageable to the business, generating greater transparency and preventing individual departments from hiding deep operational inefficiencies within nebulous administrative budgets. By recognizing that actual retail losses can reach staggering proportions when accounting for food waste, fuel mismanagement, digital inventory errors, and localized fraud, the TRL framework provides the analytical rigor necessary to identify and seal systemic vulnerabilities.
| Analytical Framework | Scope of Measurement | Primary Strategic Focus | Departmental Accountability | Treatment of Operational Waste |
|---|---|---|---|---|
| Traditional Shrinkage | Physical inventory discrepancies | External theft, internal theft, and basic paperwork errors | Isolated almost entirely to Loss Prevention / Asset Protection teams | Frequently categorized as expected "spoilage" or a standard cost of business |
| Total Retail Loss (TRL) | All events negatively impacting profitability without generating income | 31 to 42 comprehensive categories spanning the entire enterprise ecosystem | Cross-functional accountability (HR, Finance, Supply Chain, IT, Store Operations) | Categorized as measurable, manageable operational loss requiring intervention |
Simultaneously, financial analysts and retail strategists employ a secondary definition of "leakage" that evaluates macroeconomic and geographic market capture. Geographic retail leakage occurs when local residents spend more capital on products outside their immediate trade area than local businesses are able to capture. While geographic leakage indicates a failure to capture potential revenue, operational leakage, the primary focus of this analysis, represents the loss of capital and inventory already secured within the retailer's ecosystem. Both forms of leakage represent severe failures in capital optimization, but operational leakage poses a much more immediate threat to short-term corporate solvency.
The Eight Deadly Wastes of Retail Operations
To understand how revenue is continuously siphoned from a retail operation, it is essential to examine the granular inefficiencies of daily workflows. As retail businesses scale, administrative bloat often follows; in many growing enterprises, more than 90% of daily activities and time are spent on processes that provide absolutely no intrinsic value to the end consumer. Adapting Lean operational principles to the retail sector reveals the "8 Deadly Wastes" that quietly consume operating margins.
Defects & Re-work
A defect, such as a torn garment or a damaged electronic device, directly destroys the product's primary value. The financial loss extends to reverse logistics, customer service interactions, and brand degradation.
Overproduction
Procuring or manufacturing inventory without precise alignment to market demand results in "dead stock," dramatically slowing turnover and trapping working capital in goods requiring liquidation.
Waiting
Manifests on the sales floor when staff members remain idle during low-traffic periods instead of executing brand-building or merchandising tasks.
Non-Value-Added Processing
Spending capital and labor on components (such as excessive tissue paper, plastic wrap, internal packing labels, and specialized thank-you cards) that the customer immediately discards upon receipt.
Inefficiencies in transportation and the maintenance of excessive inventory physically strain the supply chain, converting fluid capital into depreciating physical assets that incur ongoing warehousing and insurance costs.
Physical Shrinkage and Digital Inventory Distortion
External Theft, ORC, and the Self-Checkout Vulnerability
Despite the expansion of the loss taxonomy, physical shrinkage remains a dominant and highly visible crisis, representing a $112.1 billion annual hemorrhage for the retail industry. The average shrinkage rate currently sits at approximately 1.6% of total retail sales, a figure that is projected to increase by over $20 billion in coming fiscal cycles as criminal tactics evolve. External theft, encompassing both opportunistic shoplifting and Organized Retail Crime (ORC), is the leading contributor, accounting for 66% of total physical shrink.
The operational dynamics and severity of external theft have shifted dramatically. From 2019 to 2023, the FBI National Incident-Based Reporting System recorded a massive 93% increase in average shoplifting incidents nationwide. More alarmingly, 91% of retailers reported a concurrent surge in the violence and aggression exhibited by perpetrators during these incidents. Organized Retail Crime compounds this issue; rather than stealing for personal consumption, ORC networks operate as highly coordinated, professional theft rings that target high-value goods across multiple locations for illicit resale in secondary markets.
The industry's aggressive pivot toward labor-saving self-checkout technology has inadvertently engineered a massive vulnerability, actively facilitating external theft. While conventional cashier lanes experience a shrink rate of just 0.2%, self-service checkouts suffer an astronomical shrink rate of 3.5%. This vast disparity is driven by a combination of accidental omissions and intentional subversion tactics, such as barcode switching (placing a cheap item's barcode over a premium item), intentional mis-scanning, and the "grab-and-go" tactic where perpetrators simply bypass the scanning infrastructure entirely.
The Rising Tide: Five-Year Leakage Trends
Retail operations have shifted dramatically towards automation. While self-checkout reduces frontend payroll, it has created a massive new vector for leakage. Tracking these loss metrics over the past five years reveals how modern retail strategies are shifting the burden of waste from traditional cashier errors to customer-facing technology friction.
The Invisible Financial Crisis of Phantom Inventory
While physical theft removes tangible merchandise from the store, "phantom inventory" creates a severe digital-physical disconnect that silently devastates both top-line revenue generation and bottom-line profitability. Phantom stock refers to inventory that is recorded as available within an accounting system or Point-of-Sale (POS) database, but which does not physically exist on the retail shelf. This phenomenon is a trillion-dollar problem globally, accounting for an average of 8% of all recorded inventory losses; effectively, for every $100 in inventory, a retailer may be losing $8 to phantom stock discrepancies.
| Financial Area Affected | Direct Business Consequence of Phantom Inventory | Operational & Compliance Impact |
|---|---|---|
| Cost of Sales | Understated on financial records | Artificially inflates perceived profitability, masking operational failures |
| Inventory Asset | Overstated on the corporate balance sheet | Increases exposure to tax liabilities and external audit failures |
| Revenue Generation | Suppressed due to algorithmic reorder failures | Causes up to 80% of out-of-stock events, directly driving away customers |
| Demand Forecasting | Corrupted historical sales and inventory data | Prevents accurate long-term budgeting and supply chain optimization |
| Cash Flow | Depleted due to phantom taxation and emergency replenishment | Funds are tied up in non-existent assets or spent correcting discrepancies |
The root causes of this data corruption are deeply embedded in operational sloppiness. Phantom stock is generated by physical retail shrinkage (stolen goods that are never marked as removed), unrecorded damages, misplaced inventory, and receiving errors at the loading dock. Poor sales recordings significantly contribute to the issue. If a consumer purchases two identical lipsticks in different colors, a hurried cashier may scan one barcode twice rather than scanning each item individually. This creates a phantom inventory entry for the color that was sold but not scanned, while triggering an unnecessary reorder for the color that was scanned twice.
Perishable Spoilage and Supply Chain Waste
In retail sectors dealing with consumables and grocery items, operational waste manifests as staggering physical and financial loss. The United States Department of Agriculture estimates that 133 billion pounds of the available food supply at the retail and consumer levels goes entirely uneaten, translating to roughly 31% of the total food supply. The retail value of this waste is immense, totaling an estimated $162 billion, with supermarkets alone losing roughly $15 billion annually solely in unsold fruits and vegetables.
Physical Waste & Operational Spoilage
Beyond payroll and admin, physical goods degrade, expire, or get damaged before they reach the consumer. This physical waste varies wildly by retail sector, requiring completely different operational strategies to mitigate. Grocery suffers from expiration, while apparel suffers from seasonal obsolescence and transit damage.
Sector-Specific Vulnerabilities
Fresh produce and dairy create the highest velocity of loss due to strict expiration timelines. However, damaged apparel and electronics represent higher per-item dollar losses. Poor cold-chain management and rough warehouse handling are the primary operational culprits driving this waste metric up.
Implementing real-time RFID tracking reduces apparel damage/loss by 34% by increasing supply chain accountability.
Retailers frequently exacerbate this loss through display strategies that prioritize visual abundance. Supermarkets routinely discard items that approach their expiration dates or exhibit minor packaging damage, fearing that consumers will perceive "suboptimal food" as a sign of poor overall quality. This creates a paradox where wasteful practices in the retail industry are perversely viewed as "good business strategies" necessary to attract affluent shoppers.
Administrative Vulnerabilities and Internal Subversion
Point-of-Sale Administrative Errors and Integration Failures
Not all transactional losses are driven by malicious intent. Administrative and paperwork errors are responsible for up to 18.8% of retail shrink. These "everyday human mistakes" occur primarily at the Point of Sale and in the back-office accounting departments, quietly chipping away at profitability without triggering security alarms.
Common POS transaction errors act as a persistent drain on margins. Duplicate invoices or payments frequently occur when a transaction is recorded multiple times due to system retries or manual overrides following temporary network interruptions. Incorrect pricing is another primary driver of leakage; small inaccuracies resulting from misconfigured tax settings, outdated price lists, or incorrectly applied discount rules compound over millions of transactions.
Employee Theft and the Crisis of Sweethearting
Internal theft remains a highly lucrative and deeply damaging vector of revenue leakage. Employees, who possess intimate knowledge of security blind spots, inventory control systems, and cash handling procedures, are responsible for 29% of all retail shrink. The most pervasive, insidious, and culturally destructive form of internal theft is known as "sweethearting."
This phenomenon occurs when a retail employee intentionally subverts the checkout process to provide unauthorized discounts, unrecorded merchandise, or improper transaction voids to friends, family members, or acquaintances. Tactics include physically skipping items over the POS scanner, processing fraudulent returns to issue illicit store credit, or deliberately incorrectly voiding legitimate sales transactions. Extensive research indicates that an astonishing 67% of retail service employees and customers admit to participating in sweethearting over a rolling two-month period. This practice bleeds approximately $50 billion annually from U.S. retailers.
The Human Capital Drain: Payroll, Labor Mismanagement, and Time Theft
Payroll is typically a retail organization's largest controllable expense, consuming between 15% and 30% of gross revenue. Any inefficiency, fraud, or mismanagement in labor tracking results in catastrophic financial leakage that directly impacts corporate solvency.
The Payroll Black Hole
Labor is a massive source of leakage. Payroll leakage occurs through outdated tracking systems, manual entry mistakes, and employee behaviors like "buddy punching."
Key Vulnerabilities
- Buddy Punching: Rampant in shift-based retail environments lacking biometric verification.
- Overtime Creep: Employees clocking out 10-15 minutes late daily, accumulating unauthorized premium pay.
- Missed Deductions: Failure of HR software to properly deduct benefits or taxes, leaving the company liable.
Buddy Punching and the Mechanics of Time Theft
Time theft is an absolute epidemic within hourly workforce environments. According to the American Payroll Association, practices such as "buddy punching" (where one employee illicitly clocks in or out on behalf of an absent or late colleague) cost U.S. employers approximately $11 billion annually. This specific form of payroll fraud is astonishingly widespread, affecting an estimated 74% to 75% of all U.S. businesses.
Process Breakdown: How Buddy Punching Works
Buddy punching is a form of time theft where one employee clocks in or out on behalf of another. It seems like a minor favor among coworkers, but scaled across a large retail chain, it accounts for millions in unearned wages. Here is the typical workflow of this systemic leakage.
The Delay
Employee A is running 20 minutes late for their scheduled floor shift.
The Request
Employee A texts Employee B, sharing their PIN or ID badge location.
The Punch
Employee B enters the system and clocks Employee A in exactly on time.
The Leakage
The retail store pays for 20 minutes of labor that was never actually performed.
| Mechanism of Payroll Leakage | Description of Subversive Activity | Estimated Financial Impact / Prevalence |
|---|---|---|
| Buddy Punching | Clocking in/out on behalf of an absent or late co-worker | Affects 74-75% of businesses; $11B total US annual loss |
| Time Inflation / Rounding | Adding small increments (e.g., 10-15 mins) to daily sheets | Averages 4.5 hours stolen per week; $2,000/employee/year |
| Ghost Employees | Terminated staff remaining active on disorganized payroll systems | Direct capital drain for entirely unrendered services |
| Unauthorized Overtime | Manipulating punches to trigger time-and-a-half payouts | Exponential margin drain due to 1.5x or 2x multiplier effects |
| Unapproved Leave | Failing to dock pay for absences due to manual tracking failures | Causes severe monthly operational deficits |
Worker Misclassification and Regulatory Penalties
In an attempt to artificially suppress labor costs and avoid payroll taxes, some retail and logistics operations deliberately misclassify their workforce. By classifying standard workers as "independent contractors" rather than W-2 employees, organizations attempt to evade obligations such as withholding income taxes, paying Social Security, and providing workers' compensation. Regulatory bodies have recognized the severe impact of misclassification, and businesses found to have incorrectly classified employees face massive civil penalties ranging from $5,000 to $25,000 per employee.
The Opportunity Cost of Chronic Understaffing
Treating store-level labor strictly as a cost center to be minimized initiates a severe downward spiral. When customer traffic peaks, 51% of associates report their store is understaffed, meaning the workforce is absent precisely when the revenue opportunity is highest. Consequently, retail environments lose an average of 14% of their potential revenue during understaffed periods simply because customers cannot access assistance or process transactions.
Post-Sale Revenue Erasure: Returns, Wardrobing, and Markdown Mismanagement
The Financial Toll of Return Fraud and Policy Abuse
In 2023, total merchandise returns reached an astronomical $743 billion, representing 14.5% of total retail sales. The processing mechanics of these returns constitute massive operational leakage. The cost to process a return averages 27% of the item's original purchase price. When factoring in reverse logistics, initial shipping costs, inspection labor, repackaging, and the inevitable discounting required to resell the open-box item, processing a return erases as much as 50% of the retailer's initial sales margin.
The Psychology of Wardrobing and Bracketing
Retailers suffer immensely from "friendly fraud" or the systemic consumer abuse of generous return policies. The practice of "wardrobing" (purchasing an item for a specific event with the explicit intent of returning it after use) skyrocketed by 38% in 2024 alone. Similarly, "bracketing" involves a consumer purchasing the exact same item in multiple sizes or colors with the premeditated intent of keeping only one and returning the rest. This practice intentionally shifts the burden of fitting rooms into the consumer's living room, forcing the retailer to absorb massive reverse logistics costs.
Pricing Errors and Markdown Misalignment
A fundamental strategic error occurs when retail executives fail to distinguish between the concepts of markdown and liquidation. A markdown is fundamentally a sales strategy; it is built on the assumption that demand for the product still exists within the primary retail channel. Liquidation, conversely, is an exit strategy; it acknowledges that the product no longer belongs in the retail channel. When a retailer mistakenly treats liquidation inventory as markdown inventory, they trap vital capital in dying products and permanently condition their consumer base to wait for steep discounts.
Value Chain, Technology, and Infrastructure Vulnerabilities
Vendor Fraud and Supply Chain Manipulation
Supply chain and vendor fraud exploits the sheer volume and velocity of B2B transactions. Common vendor fraud typologies include overbilling, where a vendor systematically inflates invoice amounts or charges for premium-grade goods while substituting inferior products. "Phantom vendors" are fictitious supply companies created by a corrupt employee within the retailer's own purchasing department, funneling corporate funds directly into personal checking accounts.
Technology Overprovisioning and Shelfware
As retail operations increasingly digitize their workflows, technology procurement has inadvertently become a silent center of massive financial waste. "Shelfware" (software licenses or Software-as-a-Service (SaaS) subscriptions that are paid for but remain unused, forgotten, or heavily underutilized) poses a significant risk. The average enterprise wastes an astonishing $19.8 million annually specifically on unused SaaS licenses, creating bloated tech stacks and unmanaged security access points.
Facility Management, Deferred Maintenance, and Energy Drift
The Department of Energy estimates that commercial buildings waste an average of 30% of the energy they consume. This is frequently caused by "energy drift" (the gradual loss of building efficiency that occurs when automated building management systems are manually overridden). Delaying necessary infrastructure repairs to preserve monthly budgets is a dangerous false economy; putting off maintenance on an aging air conditioning unit can increase heating and cooling energy consumption by as much as 20%.
Conclusions and Strategic Imperatives
The traditional approach to evaluating retail loss, focusing almost exclusively on the physical theft of merchandise from the sales floor, is fundamentally obsolete. Profit erosion is an omnichannel, cross-departmental crisis that touches every node of the corporate ecosystem. A retailer that successfully hardens its stores against organized retail crime but fails to address phantom inventory, payroll buddy punching, SaaS shelfware, and fraudulent wardrobing returns is merely shifting its losses, not sealing them.
To combat this comprehensive profit erosion and ensure long-term solvency, retail organizations must eradicate siloed accountability. Loss prevention must transition from a standalone physical security function into a holistic, enterprise-wide financial discipline. Furthermore, the industry must transition from reactive investigations to predictive analytics, utilizing integrated workforce systems to mathematically flag buddy punching and deploying exception-based POS reporting to identify sweethearting.
Ultimately, leakage and waste are symptoms of systemic operational disconnects. By illuminating the dark corners of administrative errors, facility mismanagement, and supply chain fraud, retailers can reclaim billions of dollars in lost capital, transforming operational discipline into their most profound competitive advantage.
Stop the Invisible Margin Drain Today
Operational waste, time theft, and system inefficiencies are quietly erasing your bottom line. Discover exactly where your business is losing money and how integrated workforce management can seal the leaks.
Access the Business Waste & Loss VisualizerDisclaimer: The content provided on this webpage is for informational purposes only and is not intended to be a substitute for professional advice. While we strive to ensure the accuracy and timeliness of the information presented here, the details may change over time or vary in different jurisdictions. Therefore, we do not guarantee the completeness, reliability, or absolute accuracy of this information. The information on this page should not be used as a basis for making legal, financial, or any other key decisions. We strongly advise consulting with a qualified professional or expert in the relevant field for specific advice, guidance, or services. By using this webpage, you acknowledge that the information is offered “as is” and that we are not liable for any errors, omissions, or inaccuracies in the content, nor for any actions taken based on the information provided. We shall not be held liable for any direct, indirect, incidental, consequential, or punitive damages arising out of your access to, use of, or reliance on any content on this page.
About The Author

Roger Wood
With a Baccalaureate of Science and advanced studies in business, Roger has successfully managed businesses across five continents. His extensive global experience and strategic insights contribute significantly to the success of TimeTrex. His expertise and dedication ensure we deliver top-notch solutions to our clients around the world.
Time To Clock-In
Start your 30-day free trial!
Experience the Ultimate Workforce Solution and Revolutionize Your Business Today
- Eliminate Errors
- Simple & Easy To Use
- Real-time Reporting

Saving businesses time and money through better workforce management since 2003.
Copyright © 2026 TimeTrex. All Rights Reserved.