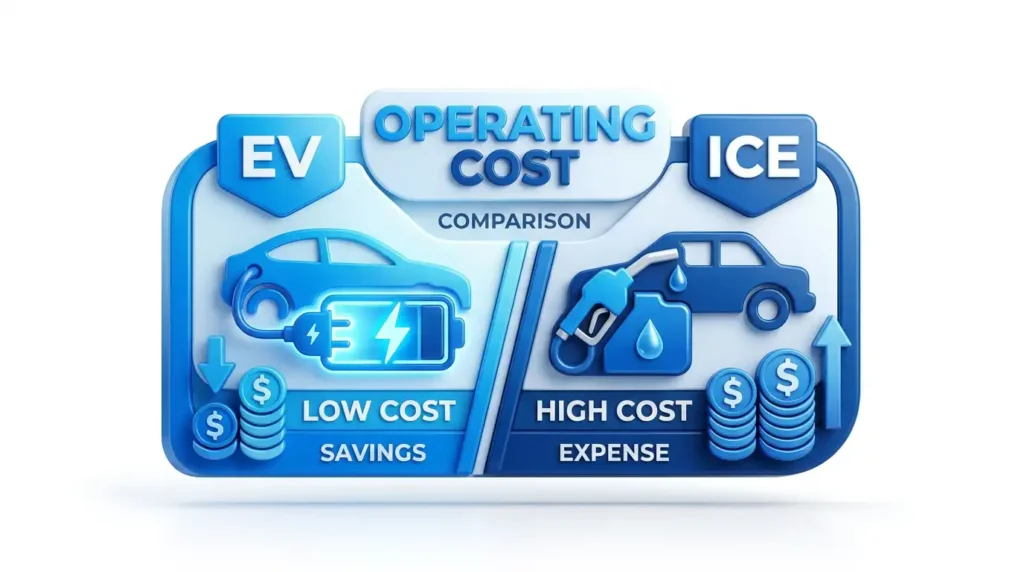
EV vs ICE Vehicle Operating Cost Calculator
Small Business Vehicle Cost Breakdown Comparison Calculator
Compare electric, gasoline, diesel, propane, and hybrid ownership costs across the major vehicle types small businesses actually use. This calculator models acquisition, energy, maintenance, tires, insurance, registration, charger expense, and the labor cost of refueling or charging downtime.
Inputs
Choose the vehicle type and duty cycle first. All price and operating assumptions can be edited.
Energy prices
EV charging mix and infrastructure
Comparison results
Results update from the selected vehicle class and job profile. The calculator compares all five powertrains side by side.
Detailed side by side cost breakdown
| Cost category | Electric | Hybrid | Gasoline | Diesel | Propane |
|---|
What is included
- Upfront acquisition versus modeled resale value
- Fuel or electricity consumption adjusted for duty cycle, payload, towing, and idling
- Maintenance, repairs, and tire wear by class and severity
- Insurance and registration estimates
- Charging or fueling downtime translated into labor cost
- Depot charger amortization for EV operations
How to use it well
- Change fuel prices and electricity rates to your actual market
- Use payload and towing inputs aggressively if your work is not light duty
- Raise downtime cost if techs, drivers, or crews are paid while waiting
- Increase DC fast share if routes exceed daily depot-charging range
- Use the results as a shortlist, then validate with exact OEM specs and local incentives
Disclaimer: This Small Business Vehicle Cost Breakdown Comparison Calculator is provided for informational and planning purposes only and does not constitute financial, tax, legal, or purchasing advice. All cost estimates, including fuel, electricity, maintenance, depreciation, downtime, and insurance, are based on generalized U.S. assumptions and user-provided inputs, which may not reflect actual market conditions, regional pricing, vehicle availability, or real-world operating performance. Results are estimates only and can vary significantly depending on driving behavior, load, terrain, climate, regulatory changes, and manufacturer specifications. Users should independently verify all inputs and consult with qualified professionals or vendors before making any vehicle purchasing or fleet management decisions.
Found our Free EV vs ICE Vehicle Operating Cost Calculator useful? Bookmark and share it.
EV Vs ICE Fleets for U.S. Small Businesses in 2026
Table of Contents
- TL;DR and Macroeconomic Context
- Capital Expenditures and Fleet Acquisition Parity
- Asset Depreciation, Residual Value Risk, and the Secondary Market
- Energy Arbitrage: The Economics of Propulsion
- Preventative Maintenance, Repair Trajectories, and Battery Lifecycles
- The Actuarial Penalty: Commercial Auto Insurance Dynamics
- Infrastructure CAPEX: The Hidden Cost of Electrification
- Regulatory Compliance, Taxation, and Grant Funding
- Opportunity Costs: Productivity, Labor, and Fleet Logistics
- Conclusion and Lifecycle Return on Investment
TL;DR and Macroeconomic Context
As the commercial transportation sector navigates the operational and economic realities of 2026, the transition from internal combustion engine (ICE) vehicles to battery electric vehicles (BEVs) has decisively evolved. For small to medium-sized enterprises (SMEs) operating localized commercial fleets, ranging from HVAC service vans to last-mile delivery box trucks and municipal service vehicles, the calculation of Total Cost of Ownership (TCO) demands a rigorous, multi-variable approach. In previous years, the decision to transition a commercial fleet to electric vehicles was frequently framed as an environmental initiative or an exercise in corporate social responsibility. However, as the market has matured through the mid-2020s, the narrative has shifted to cold, hard fiscal realism, where the "Green ROI" has become a competitive mandate rather than a theoretical projection.
The macroeconomic landscape in 2026 is fundamentally different from the early electrification push of the preceding decade. The sticker-price gap between electric and conventional commercial vehicles has narrowed dramatically, contracting from a formidable 50% premium in 2021 to roughly 12% by late 2024, driven largely by lithium-ion battery pack prices stabilizing near $108 per kilowatt-hour. Furthermore, global electric vehicle sales surpassed 10 million units annually as early as 2023, signaling a maturing supply chain, robust secondary markets, and broader mainstream acceptance among fleet operators.
Despite these advancements in manufacturing efficiency, the financial architecture supporting fleet electrification has undergone significant restructuring at the federal level. A pivotal shift occurred with the expiration of the Section 45W Commercial Clean Vehicle Credit. This critical subsidy, which previously offered up to $7,500 for light-duty commercial EVs and up to $40,000 for heavy-duty variants, effectively sunset in late 2025 under the legislative provisions of the One Big Beautiful Bill (OBBB). Small businesses can no longer rely on federal "cash on the hood" to immediately equalize the upfront capital expenditures (CAPEX) associated with procuring electric assets. Instead, the financial justification for EV adoption in 2026 relies almost entirely on the operational expenditure (OPEX) advantages engineered into the electric powertrain, countered by the secondary capital costs of charging infrastructure, elevated commercial auto insurance premiums, and localized taxation mechanisms designed to replace declining gas tax revenues.
This comprehensive analysis evaluates the absolute and relative costs of EV versus ICE fleet ownership for U.S. small businesses. It deconstructs the TCO equation into its constituent parts: initial acquisition pricing and depreciation trajectories, energy arbitrage (comparing stable electricity tariffs against volatile middle distillates), preventative maintenance and lifecycle battery management, insurance actuarial realities, and the productivity impacts of localized charging infrastructure. By synthesizing these elements, the following report provides a definitive framework for small fleet operators to accurately assess the long-term viability and financial mechanics of electrification within the current economic and regulatory environment.
Capital Expenditures and Fleet Acquisition Parity
The traditional barrier to commercial EV adoption has invariably been the high upfront acquisition cost. In 2026, while absolute price parity has not been universally achieved across all vehicle classes, the premium has compressed to a margin where long-term operational savings can realistically offset the initial hurdle within standard corporate financing windows. The viability of this financial model, however, is highly dependent on the specific vehicle segment required by the business.
Commercial Vehicle Acquisition Costs by Segment
The commercial light-duty truck and cargo van segments represent the backbone of U.S. small business operations. Automakers, recognizing the lucrative nature of the fleet market, have responded to commercial demand by introducing fleet-specific trims that prioritize range, durability, and payload over luxury amenities. A direct comparison of the 2026 model year offerings highlights the remaining delta between EV and ICE capital costs across different form factors.
| Vehicle Segment | 2026 Electric Model | 2026 MSRP (EV) | 2026 ICE Equivalent Model | 2026 MSRP (ICE) | Acquisition Premium (EV) |
|---|---|---|---|---|---|
| Cargo Van | Ford E-Transit Cargo Van | $53,260 | Ford Transit Cargo Van | $48,400 | +$4,860 |
| Light-Duty Pickup | Ford F-150 Lightning (Pro/STX) | $52,375 - $63,345 | Ford F-150 (XL/STX) | $38,710 | +$13,665 to +$24,635 |
| Light-Duty Pickup | Chevrolet Silverado EV (WT/LT) | $52,800 - $71,695 | Chevrolet Silverado 1500 (WT) | ~$38,000* | +$14,800 to +$33,695 |
| Light-Duty Pickup | GMC Sierra EV | $64,995 | GMC Sierra 1500 (Pro) | ~$39,000* | +$25,995 |
| Premium Pickup | Rivian R1T | $73,000+ | N/A (No direct commercial equivalent) | N/A | N/A |
*Note: ICE Silverado and Sierra estimates are based on standard 2026 commercial fleet baselines as direct comparisons for their EV counterparts.
The data indicates a stark divergence in price parity depending on the aerodynamic profile and intended duty cycle of the vehicle. The CAPEX premium for an electric cargo van, such as the widely adopted Ford E-Transit, is remarkably narrow, sitting at less than $5,000 over its traditional gas-powered twin. For localized delivery and service fleets operating predetermined routes of under 100 to 150 miles per day, this minimal premium is rapidly amortized by fuel and maintenance savings. When financed over a standard 60-month commercial auto loan, a $4,860 premium equates to an increased debt service of approximately $95 per month, a figure easily eclipsed by the monthly reduction in gasoline expenditures.
Conversely, the electric pickup truck segment maintains a significantly wider acquisition gap. The 2026 Ford F-150 Lightning STX and the Chevrolet Silverado EV command starting prices in the low-to-mid $50,000 range for their most basic fleet-oriented trims, representing a premium of nearly $14,000 over base-level ICE work trucks. If a fleet requires extended range, the acquisition cost escalates rapidly; the 2026 Silverado EV capable of up to 493 miles of range pushes the acquisition price past $71,000.
The higher cost of electric pickups is inextricably linked to their battery architecture and the physics of towing. To overcome the aerodynamic drag inherent in a pickup truck design and to provide sufficient torque for towing loads up to 10,000 pounds, manufacturers must install massive high-voltage batteries. While standard-range packs hover around 98 kWh, the extended-range packs required for heavy commercial duty can reach 131 kWh or larger. Despite the per-kilowatt-hour cost of battery cells dropping significantly over the past half-decade, packaging packs of this magnitude inherently establishes a high, inflexible price floor for the vehicle. Small businesses must, therefore, carefully evaluate whether their operations genuinely require the towing capacity and form factor of an electric pickup, or if the significantly cheaper electric cargo van can fulfill their logistical requirements.
Asset Depreciation, Residual Value Risk, and the Secondary Market
A critical, yet frequently underestimated, component of the commercial TCO equation is the vehicle's residual value at the end of its operational duty cycle. Depreciation has historically been the most significant hidden cost for early adopters of electric fleets, creating substantial balance sheet volatility for small enterprises.
The Aggressive EV Depreciation Curve
According to comprehensive industry tracking and valuation models, new electric vehicles have historically lost an average of $43,515 in value over a five-year period, whereas comparable internal combustion engine vehicles depreciated by approximately $27,883 over the same timeframe. This aggressive depreciation curve is driven by a confluence of macroeconomic, psychological, and technological factors unique to the EV ecosystem.
First, the rapid pace of battery chemistry and charging architecture innovation essentially renders three-year-old electric vehicles technologically inferior compared to newer models. As original equipment manufacturers (OEMs) transition vehicle platforms from 400-volt to 800-volt architectures, unlocking significantly faster megawatt charging capabilities and superior thermal management, the older 400-volt vehicles suffer accelerated devaluation in the secondary market. Second, secondary market buyers, including smaller owner-operators, harbor deep-seated "range anxiety" and profound concerns regarding out-of-warranty battery degradation. The fear of inheriting a degraded battery that requires a catastrophic replacement expense heavily suppresses the resale value of the asset. Finally, aggressive price cuts implemented by primary manufacturers in 2024 and 2025 to stimulate lagging new car demand effectively anchored the used market at depressed valuations, punishing fleets that had acquired assets at peak pricing.
For a small business establishing an operational model spanning a standard five-year lifecycle, this aggressive depreciation poses a severe financial risk if acquiring brand-new vehicles. A modeled scenario of a new fleet asset driven 20,000 miles annually demonstrates this dynamic clearly. A late-model used compact EV acquired for $20,000 is projected to retain only $6,000 in residual value after five years, representing a total lifecycle depreciation of $14,000 (a 70% loss in retained value). Similarly, a used gasoline sedan acquired for $18,000 will depreciate to roughly $5,000 over the same period (a 72.2% loss). While the percentage loss is similar in the used market, the absolute dollar loss on a brand-new $60,000 EV dropping to $15,000 over five years can devastate a small business's capital recovery strategy.
Strategic Acquisition via the Used Fleet Market
This market reality, however, presents a distinct arbitrage opportunity for savvy fleet operators. Generous depreciation, fast product cycles, and the anxieties of early adopters have created a surplus of late-model used EVs with depressed resale values. By acquiring vehicles aged one to five years, small businesses can completely sidestep the steepest and most punishing segment of the depreciation curve. These off-lease vehicles have already absorbed the financial impact of their initial technological obsolescence but still retain more than enough battery health to comfortably complete daily 100-mile commercial duty cycles.
Fleet managers executing this secondary-market strategy must rigorously filter acquisitions based on the battery's quantified State of Health (SoH). Relying solely on the dashboard range estimator is insufficient for commercial procurement. Vehicles equipped with active liquid thermal management systems consistently exhibit slower degradation profiles and age significantly better under heavy commercial strain compared to passively cooled architectures. Assuming conservative residual values at the end of the operational term insulates the business from market volatility; any salvageable equity recovered at disposal should be classified as supplementary capital rather than a fundamental pillar of the TCO projection.
Energy Arbitrage: The Economics of Propulsion
If capital expenditures represent the headwind of fleet electrification, operational expenditures represent the persistent tailwind. The physical simplification of the electric drivetrain, combined with the inherently higher thermodynamic efficiency of electric motors, fundamentally restructures the month-to-month financial obligations of the enterprise. The most immediate and visible manifestation of this shift is the cost of energy.
The Volatility of Petroleum vs. The Stability of the Grid
Fuel represents between 20% and 30% of a standard ICE fleet's total operating expenses. In 2026, the global petroleum market remains subject to deep geopolitical volatility, domestic refining constraints, and seasonal demand fluctuations. The U.S. Energy Information Administration (EIA) projects the 2026 annual average retail price of gasoline to hover around $3.34 per gallon, with short-term seasonal peaks reaching $3.58 per gallon. Diesel fuel, the primary energy source for medium and heavy-duty commercial operations, is projected to average $4.12 per gallon nationwide, with specific regional markets such as the West Coast and California experiencing rates exceeding $6.30 to $6.80 per gallon.
This pricing volatility complicates annual budgeting for small businesses and forces fleets to rely on reactionary fuel surcharges that often lag behind real-time market spikes, thereby compressing operating margins. When diesel prices rise quickly, the effect is immediate: higher per-mile costs and tighter margins that cannot be easily mitigated through incremental efficiency gains like route optimization or idle reduction.
Average Gas Cost per Mile
$0.14 - $0.18Subject to high geopolitical and seasonal volatility, deeply impacting thin operating margins.
Average EV Cost per Mile
$0.08Stable commercial electricity rates provide predictable OPEX and long-term budgeting security.
In stark contrast, commercial electricity rates offer profound pricing stability and a structural cost advantage. While national electricity prices have seen above-inflation increases in certain jurisdictions due to grid upgrades, natural gas supply constraints, and transmission investments, the cost per mile for EV operations remains decisively lower. Across the United States, commercial electricity rates average around 16 to 20 cents per kilowatt-hour (kWh), rendering electricity 40% to 65% cheaper per mile than gasoline. A localized study indicates that powering an electric fleet costs an average of $0.08 per mile compared to $0.14 to $0.18 per mile for fossil fuels.
Time-of-Use Tariffs and Localized Case Studies
The true financial power of fleet electrification is unlocked through Time-of-Use (TOU) tariff optimization. Regulated utility providers actively incentivize off-peak charging to stabilize the localized electrical grid, preventing brownouts during peak daytime usage. Fleet operators who align their charging schedules with these utility incentives can achieve extraordinary reductions in their energy expenditures.
The state of Florida provides a highly representative case study of these dynamics. In March 2026, the average commercial electricity rate in Florida is approximately 16 cents per kWh, roughly 19% lower than the national average. Major utilities in the state have introduced aggressive pricing structures to court commercial EV fleets. Duke Energy Florida, for instance, implemented a rate reduction in March 2026, dropping commercial and industrial bills by 9.6% to 15.8% following the removal of previous storm cost recovery charges.
However, Florida Power & Light's (FPL) EVolution fleet program demonstrates the profound arbitrage available through TOU charging. FPL offers a dramatic variance in energy pricing based on consumption hours. Under the 2026 FPL Flexible Program structure, the commercial TOU rate charges 22.583 cents per kWh during on-peak daytime hours, but plummets to an astonishingly low 2.016 cents per kWh during off-peak overnight hours.
Small businesses operating fixed daily routes, such as plumbing, landscaping, or parcel delivery, benefit immensely from this structural variance. Vehicles are dispatched during the day to complete their duty cycles and return to the depot in the evening. By programming the fleet's telematics and networked chargers to initiate charging exclusively during the off-peak window (e.g., 11:00 PM to 5:00 AM), the fleet virtually eliminates its exposure to peak energy pricing.
At 2.016 cents per kWh, the cost to completely recharge an 80 kWh battery (yielding approximately 200 miles of commercial range) is less than $1.65. To drive an equivalent 200 miles in a gasoline-powered van achieving 15 miles per gallon at the EIA's projected $3.34 per gallon, the fuel cost would exceed $44.50. This energy arbitrage fundamentally alters the OPEX equation, producing thousands of dollars in absolute annual savings per vehicle compared to internal combustion equivalents refueling at volatile spot-market prices.
Preventative Maintenance, Repair Trajectories, and Battery Lifecycles
Beyond the cost of energy, the mechanical complexity of a commercial vehicle directly correlates with its lifecycle maintenance requirements and its total operational downtime. The transition from internal combustion to battery electric propulsion represents a radical simplification of the vehicle's underlying architecture.
The Mechanical Simplicity of the Electric Drivetrain
A traditional internal combustion engine powertrain contains more than 2,000 highly stressed moving parts, requiring continuous lubrication, intense thermal management, and precise friction mitigation to prevent catastrophic failure. In contrast, a battery electric vehicle powertrain operates with approximately 20 moving parts. This structural simplification completely eliminates the need for routine oil changes, spark plug replacements, transmission fluid flushes, engine air filter replacements, and exhaust system repairs.
Furthermore, the integration of regenerative braking systems fundamentally alters wear-and-tear schedules. By utilizing the resistance of the electric motor to decelerate the vehicle and recapture kinetic energy back into the battery, EVs drastically reduce the friction and heat applied to traditional brake pads and rotors. Consequently, brake servicing intervals on commercial EVs are often extended by a factor of three or four compared to identical ICE vehicles operating on the same stop-and-go delivery routes.
Actuarial data gathered from commercial fleet operators spanning 2025 and 2026 confirms these theoretical savings in real-world applications. Consumer Reports estimates that the lifetime scheduled maintenance and repair costs for a BEV average $4,600, translating to roughly $0.031 per mile. The equivalent ICE vehicle demands $9,200 in lifetime maintenance, or $0.061 per mile. The U.S. Department of Energy corroborates these figures, reporting scheduled maintenance averages of under $0.07 per mile for EVs compared to roughly $0.10 per mile for ICE platforms. Fleet operators managing mixed inventories explicitly report higher overall satisfaction with their EV assets, noting that overall powertrain maintenance costs can be reduced by up to 40% over the vehicle's lifespan.
Battery Replacement Risks and Mitigation Strategies
The primary counterargument regarding EV maintenance focuses on the catastrophic financial risk of high-voltage battery failure. Replacing the primary traction battery in a commercial EV is a massive undertaking that can easily exceed the residual value of an older vehicle.
| Battery Replacement Scenario (Ford F-150 Lightning / E-Transit) | Estimated Total Cost (Parts + Labor) |
|---|---|
| Complete High-Voltage Pack (OEM New - Standard Range) | $15,000 - $20,000+ |
| Complete High-Voltage Pack (OEM New - Extended Range) | $18,000 - $25,000+ |
| Refurbished / Used Pack from Recycler | $12,000 - $18,000+ |
| Module-Level Internal Repair | $3,000 - $10,000+ |
As detailed in the matrix above, replacing the massive 98 to 131 kWh battery pack in a 2026 Ford F-150 Lightning can command between $15,000 and $25,000+ for OEM parts and specialized labor at retail rates. However, the severity of this risk is heavily mitigated by federally mandated warranty structures and the evolving aftermarket repair ecosystem.
Commercial EVs, including the Lightning and E-Transit, carry high-voltage battery warranties covering eight years or 100,000 miles, legally guaranteeing a minimum capacity retention of 70%. Because the typical commercial duty cycle for small businesses often triggers vehicle replacement prior to the eight-year mark, the risk of an out-of-pocket battery replacement is effectively transferred back to the original equipment manufacturer. Modern EV batteries are proving highly durable under commercial loads, demonstrating average degradation rates of merely 2.3% per year.
If a commercial vehicle surpasses the warranty limit and suffers an isolated cell or module failure, it is rarely necessary to replace the entire pack. The secondary market has matured significantly by 2026, offering localized module-level repairs or refurbished pack installations for significantly less ($3,000 to $10,000) than an OEM-new replacement. Fleet managers must weigh this remote tail-risk against the guaranteed, day-to-day savings achieved by eliminating routine mechanical maintenance.
Optimize Your Fleet Workforce Management
Whether you manage an EV or ICE fleet, tracking labor, routing, and payroll shouldn't be a roadblock. Take control of your time and attendance today.
Explore TimeTrex for Your IndustryThe Actuarial Penalty: Commercial Auto Insurance Dynamics
While energy and maintenance costs heavily favor the electric vehicle, commercial auto insurance presents a severe and persistent OPEX penalty that threatens to undermine the ROI for small businesses. Comprehensive data from the Association of British Insurers, alongside U.S. actuarial studies spanning 2025 and 2026, demonstrate that EV insurance premiums remain 25% to 50% higher than those for equivalent ICE vehicles. For a commercial fleet, typical annual EV premiums average approximately $4,000 per vehicle, compared to roughly $2,700 for their internal-combustion counterparts.
This profound premium disparity is not driven by the frequency of collisions (EVs are generally involved in accidents at similar or slightly lower rates than traditional vehicles) but by the exorbitant severity of the claims when collisions do occur. The underlying causes of these elevated repair bills are deeply rooted in the physical design of the vehicles:
- The Minor Accident Trap: EV battery packs are typically integrated into the floorpan of the vehicle, serving as a stressed structural member of the chassis to improve rigidity and safety. However, a low-speed collision, a curb strike, or an undercarriage impact that even slightly compromises the protective battery casing can force an insurer to declare the entire vehicle a total write-off. Because the risk of thermal runaway (a catastrophic battery fire) is severe if the internal cells are compromised, insurers rarely authorize casing repairs. Thus, what would be a $1,500 suspension or exhaust repair on an ICE vehicle escalates into a $20,000 total loss settlement on an EV.
- Specialized Labor Scarcity: Servicing a damaged high-voltage system requires heavily insulated bays, specialized OEM diagnostic tools, quarantine areas, and technicians extensively trained in high-voltage safety protocols. The relative scarcity of these qualified service centers allows authorized repair facilities to command elevated hourly labor rates, increasing total claims costs by 20% to 50% over traditional auto body shops.
- Sensor Density and Calibration: Electric vehicles are inextricably linked to advanced driver-assistance systems (ADAS). The bumpers, fascias, and windshields are heavily embedded with LiDAR, radar, and ultrasonic sensors. Following a collision, these sensors require precise, costly recalibration to function correctly, adding significant expense to even minor cosmetic repairs.
To mitigate their own risk exposure, commercial insurers often implement higher compulsory deductibles (excess levels) on EV policies, forcing the small business to pay more out-of-pocket before coverage initiates. For small fleet operators, the insurance penalty represents an unyielding fixed cost that continuously chips away at the variable savings achieved through cheap electricity and reduced maintenance. To overcome this insurance deficit, an EV must be driven a sufficient number of annual miles to allow the per-mile energy and maintenance savings to mathematically outpace the fixed annual premium hike.
Infrastructure CAPEX: The Hidden Cost of Electrification
Procuring electric vehicles represents only the first phase of electrification. The secondary phase, deploying the refueling infrastructure, introduces formidable hidden capital costs and significantly alters the fundamental daily workflow of the business. The architectural decisions made during the design of a fleet depot dictate the operational flexibility and the financial success of the transition.
Hardware Selection and Installation Economics
Commercial EV charging is distinctly categorized by power output, dictating the speed of energy replenishment and the scale of the initial investment. Small businesses must carefully match the charging hardware to the "dwell time" (the duration a vehicle remains parked and inactive at the facility).
| Charging Technology | Power Output | Ideal Fleet Application | Installed Cost Per Port (2026 Est.) |
|---|---|---|---|
| Level 2 (AC) | 3.3 kW to 19.2 kW | Overnight depot charging; vehicles parked 8+ hours. | $3,500 to $15,000 |
| DC Fast Charging (Level 3) | 50 kW to 500 kW | Rapid turnaround required; mid-shift top-ups. | $18,000 to $350,000+ |
For light-duty fleets returning to a central depot overnight, Level 2 AC charging is the pragmatic and highly economical workhorse. A 19.2 kW charger can easily replenish a depleted 100 kWh battery over a standard 10-hour nighttime dwell period. The total cost to install a Level 2 port generally lands between $3,500 and $15,000. This wide variance is heavily dependent on site-specific civil engineering factors: the distance from the main electrical panel to the parking space, the necessity of trenching through concrete or asphalt, and any minor service upgrades required to support the additional load.
Attempting to scale a facility with DC Fast Charging (DCFC) dramatically escalates the financial burden. The hardware alone for high-capacity rapid chargers, capable of pumping 50 to 150 kW into a vehicle, costs tens of thousands of dollars. When combined with the necessary utility-side transformer upgrades, extensive civil engineering, and specialized municipal permitting, a single DCFC port can demand an investment exceeding $100,000, quickly reaching $350,000 for heavy-duty hub configurations. For a small enterprise, over-capitalizing on DCFC hardware when Level 2 chargers would suffice destroys the fleet's ROI and traps critical capital in underutilized infrastructure.
Proper facility load studies are paramount. Plugging ten Level 2 commercial chargers into an un-upgraded industrial electrical panel without intelligent load-management software can trip breakers or, more insidiously, force the business into highly punitive utility demand-charge brackets. The utilization of Open Charge Point Protocol (OCPP) compliant software allows fleet managers to throttle the power delivery to individual vehicles, prioritizing trucks that require an early morning departure while delaying others to prevent total site load from exceeding existing grid capacity.
Offsetting Infrastructure Costs via Make-Ready Credits
While the Section 45W vehicle credit has expired, the federal government and utility providers continue to aggressively subsidize the infrastructure side of the equation. Under Section 30C of the federal tax code, businesses installing qualified alternative fuel vehicle refueling property can claim a commercial charging tax credit covering up to 30% of the hardware and installation costs, capped at $100,000 per charger. This credit is highly relevant for localized fleet depots and is slated to remain active until at least the end of the decade, allowing fleets to offset the heavy civil engineering costs of trenching and electrical panel upgrades.
Electric utility providers, recognizing the immense value of commercial fleets as stable, predictable consumers of off-peak power, also provide robust infrastructure incentives. Duke Energy's Commercial Charger Rebate Program offers between $304 and $1,175 for standard Level 2 installations, and up to $35,600 to offset the exorbitant costs of DC Fast Chargers. Similarly, Florida Power & Light's Make-Ready Credit program directly subsidizes the "behind-the-scenes" electrical infrastructure (transformers, conduits, and heavy-duty wiring) required to power depot charging banks, providing up to $20,000 per port depending on nameplate capacity, with site caps stretching up to $300,000 for massive installations.
Regulatory Compliance, Taxation, and Grant Funding
The macro-shift from fossil fuels to electric power has fundamentally disrupted public infrastructure funding models. For nearly a century, road construction and maintenance across the United States have been funded primarily through per-gallon excise taxes levied on gasoline and diesel. As electric vehicles consume no liquid fuel, their operators effectively bypass this traditional revenue stream. To correct this imbalance, state legislatures have enacted new regulatory frameworks that commercial fleets must incorporate into their financial models.
Offsetting the Gas Tax: State-Level EV Registration Fees
By 2026, at least 41 states have imposed special annual registration fees specifically targeting battery-powered electric vehicles. These fees range from a low of $50 in states like Colorado and South Dakota to nearly $290 in jurisdictions such as New Jersey. To preserve purchasing power against inflation, 12 states have structured these fees to increase annually based on the Consumer Price Index (CPI), and several have begun factoring in the gross weight of the vehicle, acknowledging that heavier EV batteries induce greater physical wear on asphalt surfaces.
Florida serves as a prime example of this legislative trend. Facing declining fuel tax revenues that threatened county-level infrastructure projects, the Florida legislature advanced measures to capture revenue from the growing alternative fuel sector. Effective July 1, 2026, Florida law mandates under Senate Bill 804 that owners of battery electric vehicles must pay a supplemental annual fee of $250 upon initial registration and at each subsequent annual renewal. These collected funds are deposited directly into the State Transportation Trust Fund for the maintenance of public roads.
From the perspective of a casual retail driver covering 10,000 miles a year, a $250 flat fee might represent a higher tax burden than the equivalent gas tax they would have paid at the pump. However, for a commercial small business fleet, this flat-fee structure is highly advantageous and represents a significant TCO benefit. A commercial diesel delivery van traveling 30,000 miles annually at 15 miles per gallon consumes roughly 2,000 gallons of fuel. In Florida, where state motor fuel taxes increased to 22 cents per gallon in early 2026 (excluding variable local options), the commercial operator pays over $440 in state fuel taxes alone. By transitioning to an electric van, the business locks in its road tax liability at a flat $250, permanently severing the link between mileage accumulation and taxation. The more heavily the EV is utilized, the lower its effective tax rate per mile becomes.
Regional Grant Funding and Environmental Subsidies
Beyond the tax code, localized air-quality initiatives continue to fund fleet transitions, particularly for heavier vehicle classes that disproportionately pollute urban corridors. The Diesel Emissions Reduction Act (DERA) and funds derived from the historic Volkswagen Settlement are actively deployed to remove heavily polluting older diesel trucks from the road.
In 2026, the Florida Department of Environmental Protection's Diesel Emissions Mitigation Program (DEMP) allocated a targeted $20 million to subsidize the replacement of aging Class 8 municipal service and port drayage trucks. This program offers non-governmental private commercial entities operating under municipal contracts up to $150,000 per replacement unit to adopt cleaner technologies, provided they destroy their pre-2009 diesel assets. While these heavy-duty grants are highly specific, similar localized programs exist nationwide, such as California's HVIP program, which provides substantial "cash on the hood" vouchers (up to $16,000 per vehicle) to incentivize the deployment of electric vans like the Ford E-Transit in densely populated urban zones.
Opportunity Costs: Productivity, Labor, and Fleet Logistics
When calculating the TCO of an EV fleet, many small businesses fail to account for the indirect opportunity costs, and opportunity savings, that arise from changing the daily operational workflow of their drivers.
Reclaiming Labor Hours from Retail Fueling
The transition to depot-based charging introduces a massive hidden productivity asset: reclaimed labor hours. In a traditional ICE paradigm, fleet drivers must routinely deviate from their service routes to visit retail gas stations. A 15-minute detour to navigate traffic, wait at the pump, refuel, and process a fleet fuel card, occurring just three times a week, consumes 45 minutes of a driver's paid labor. Over a 50-week operational year, this equates to 37.5 hours of unproductive, compensated labor per vehicle.
By shifting to localized, on-site fueling, where vehicles are simply plugged in by the driver at the end of their shift and charged automatically overnight, the business reclaims those labor hours. The true cost of gasoline is not just the price on the marquee, but the hourly wage of the employee standing next to the pump. Eliminating this requirement creates a streamlined operational loop that lowers the holistic cost of deploying the fleet.
The Penalty of Payload and Range Constraints
However, the electric transition is not devoid of operational friction. The physics of electric propulsion introduce hard limits on gross vehicle weight (GVW). High-capacity lithium-ion batteries are extraordinarily heavy. A commercial truck designed to remain below the 10,000-pound regulatory threshold must sacrifice a substantial portion of its maximum payload capacity to accommodate the weight of its own power source. For fleets transporting dense, heavy materials (such as liquid tanks, heavy HVAC equipment, or construction aggregates), the reduced payload capacity means the business may need to execute more trips to transport the exact same volume of goods, accelerating wear on the vehicle and demanding more labor.
Furthermore, if a vehicle's battery capacity is insufficient to complete a daily route under adverse conditions (such as cold weather degradation or heavy cargo loads), the driver must hunt for public DC Fast Charging mid-shift. Public fast charging introduces severe opportunity costs, stranding highly paid personnel at retail charging plazas for 30 to 60 minutes, severely disrupting delivery schedules, and forcing the business to pay inflated retail electricity rates that instantly erode the OPEX advantages of the vehicle.
Conclusion and Lifecycle Return on Investment
As the U.S. commercial market operates through 2026, the debate regarding the viability of electric vehicle fleets for small businesses has transitioned from ecological theory to rigorous economic strategy. The absolute parity of upfront capital costs remains elusive, particularly in the heavy-duty and long-range pickup segments where massive battery packs dictate high MSRPs. Furthermore, the expiration of sweeping federal purchasing credits places the burden of financial justification squarely on the operational efficiency of the vehicles.
Synthesizing the disparate costs and benefits yields a nuanced lifecycle profile. A comprehensive Total Cost of Ownership analysis must encompass a five-to-ten-year horizon to accurately reflect the true cost. The equation is uncompromising: Initial CAPEX + Infrastructure Cost + Energy + Maintenance + Insurance + Taxes - Residual Value.
The traditional gas-powered fleet benefits from lower initial acquisition costs, vast operational flexibility via rapid public refueling, and lower commercial insurance premiums. However, it is fundamentally burdened by volatile, highly taxed fuel costs, frequent preventative maintenance downtime, and the steady accumulation of unproductive labor hours spent refueling. Conversely, the electric fleet is initially penalized by higher purchase prices, severe depreciation curves on new assets, elevated insurance premiums driven by complex repairs, and the formidable civil engineering costs of installing a private depot charging network. Yet, these costs are relentlessly neutralized over time by structurally cheaper energy (capitalizing on overnight TOU rates), drastically reduced mechanical maintenance, flat-fee state taxation, and the total elimination of retail fueling downtime.
Mathematical models focused on localized delivery routes conclude that the operational savings of EVs aggressively overtake the capital penalties between years three and five of the vehicle's lifespan. As the lifecycle extends toward year ten, the economic gap widens exponentially in favor of the electric platform, provided the underlying battery maintains sufficient State of Health to prevent a mid-lifecycle replacement shock.
To secure the projected ROI, small business fleet managers must operate defensively. Businesses should avoid the temptation of over-purchasing range; investing in a 300-mile battery for an 80-mile route wastes capital and sacrifices critical payload. The secondary market provides a powerful shield against technological depreciation, allowing savvy operators to acquire 1-to-5-year-old commercial EVs at steep discounts. Finally, infrastructure must be right-sized, maximizing economical Level 2 charging while aggressively pursuing utility make-ready credits and the remaining Section 30C federal subsidies.
Ultimately, the successful integration of an electric fleet depends not on the technology itself, but on the precision of its deployment. Small businesses that accurately match their vehicle acquisitions to defined, localized duty cycles will construct an operational cost floor that traditional internal combustion fleets simply cannot match over a ten-year horizon.
Disclaimer: The content provided on this webpage is for informational purposes only and is not intended to be a substitute for professional advice. While we strive to ensure the accuracy and timeliness of the information presented here, the details may change over time or vary in different jurisdictions. Therefore, we do not guarantee the completeness, reliability, or absolute accuracy of this information. The information on this page should not be used as a basis for making legal, financial, or any other key decisions. We strongly advise consulting with a qualified professional or expert in the relevant field for specific advice, guidance, or services. By using this webpage, you acknowledge that the information is offered “as is” and that we are not liable for any errors, omissions, or inaccuracies in the content, nor for any actions taken based on the information provided. We shall not be held liable for any direct, indirect, incidental, consequential, or punitive damages arising out of your access to, use of, or reliance on any content on this page.
Trusted By
Trusted by 3.4M+ Employees: 23 Years of Service Across Startups to Fortune 500 Enterprises
Join our ever-growing community of satisfied customers today and experience the unparalleled benefits of TimeTrex.


Strength In Numbers
Join The Companies Already Benefiting From TimeTrex
Time To Clock-In
Start your 30-day free trial!
Experience the Ultimate Workforce Solution and Revolutionize Your Business Today
- Eliminate Errors
- Simple & Easy To Use
- Real-time Reporting

Saving businesses time and money through better workforce management since 2003.
Copyright © 2026 TimeTrex. All Rights Reserved.