
Employee Absence Rate Calculator
Employee Absence Rate Calculator
See the time lost. Understand the impact. Plan what comes next.
Your absence data
Illustrative exampleReplace the example with totals for one workforce and one reporting period.
Help me count scheduled workdays
CSV columns: department, average_headcount, scheduled_hours, absent_hours. CSV time is always in hours; an import switches the display to hours. Blank headcount is allowed.
Results update as you edit. The button also checks inputs and takes you to your result.
Compare reporting periods
Compare rates even when the total scheduled time changes.
Enable comparison to see the change.
Copies the current totals into the previous period. Enter the new current period afterward.
Model the cost and a target
Use your own assumptions to turn lost time into a planning estimate.
A target is a planning assumption. The rate alone does not explain causes or measure an individual employee’s reliability.
Your reporting period
Time lost as a share of scheduled timeDay equivalents use your selected workday length.
—
Modeled cost exposure
—- Paid-time allocation
- —
- Additional coverage spend
- —
For this period. Allocation plus incremental spend; excludes unentered costs.
Your target scenario
——
Assumes the same schedule and cost assumptions. Target attainment and financial effects are not guaranteed.
Department comparison
Bar lengths use the same 0–100% scale. The table gives exact rates.
| Department | Scheduled hours | Lost hours | Rate |
|---|
How the absence rate is calculated
Count time employees were expected to work but missed under your selected absence definition. Use the same period and units on both sides. Scheduled time includes the counted lost time; subtracting it again would inflate the rate.
For departments, add lost time and scheduled time first, then divide. For example, 10 hours lost out of 100 plus 10 out of 900 gives 2% overall, rather than the simple average of the two rates.
What should I include or exclude?
For unplanned absence, exclude planned vacation, nonworking holidays, and other time outside the agreed work schedule from the input scope. If you measure all recorded absence, use a scheduled-time base that includes those counted categories. This calculator does not deduct leave or holidays automatically.
Record partial shifts in hours. For variable schedules, use actual hours instead of counting every absence as one full day. Do not include replacement staff or extra overtime in the original schedule solely to dilute the rate.
Make the results useful
What is a good absence rate?
There is no universal threshold in this tool. Compare your own workforce over time and check that any external benchmark uses the same absence categories, denominator, and reporting period. The 3% target shown here is an editable example.
Is this the same as the BLS absence rate?
No. The U.S. Bureau of Labor Statistics uses “absence rate” for the share of eligible workers with an absence. This calculator measures the share of scheduled time lost, which is a different metric. National survey figures also have different coverage and methods.
How are days and costs handled?
Day figures are equivalent workdays at your selected hours per day, rather than counts of absence events. Currency changes relabel values. Paid-time allocation can represent payroll already committed; the target’s coverage saving estimates only the extra coverage spending potentially avoided.
Does the calculator save my employee data?
The calculator processes aggregate inputs in your browser and makes no network requests. It uses no cookies or persistent browser storage. Download settings to keep a copy; a page refresh clears your entries. The hosting website may have its own analytics.
Methodology: Institute for Employment Studies · BLS definitions · Acas recording guidance
Planning estimate based on the data and scope you enter. Review absence causes and context before making decisions about employees. A rate alone is not a basis for automatic disciplinary action.
Disclaimer: The Employee Absence Rate Calculator provides planning estimates based on the data, absence definitions, schedules, and cost assumptions you enter. Results may vary with record accuracy, leave policies, and workforce arrangements and should be verified against your organization’s records. Day figures are workday equivalents, and cost estimates or target scenarios do not guarantee savings. This tool does not provide legal, payroll, or HR advice, and absence rates alone should not be used to assess individual employees or trigger disciplinary action.
Found our Free Employee Absence Rate Calculator useful? Bookmark and share it.

Disclaimer: The content provided on this webpage is for informational purposes only and is not intended to be a substitute for professional advice. While we strive to ensure the accuracy and timeliness of the information presented here, the details may change over time or vary in different jurisdictions. Therefore, we do not guarantee the completeness, reliability, or absolute accuracy of this information. The information on this page should not be used as a basis for making legal, financial, or any other key decisions. We strongly advise consulting with a qualified professional or expert in the relevant field for specific advice, guidance, or services. By using this webpage, you acknowledge that the information is offered “as is” and that we are not liable for any errors, omissions, or inaccuracies in the content, nor for any actions taken based on the information provided. We shall not be held liable for any direct, indirect, incidental, consequential, or punitive damages arising out of your access to, use of, or reliance on any content on this page.
Trusted By
Trusted by 3.4M+ Employees: 23 Years of Service Across Startups to Fortune 500 Enterprises
Join our ever-growing community of satisfied customers today and experience the unparalleled benefits of TimeTrex.










Strength In Numbers
Join The Companies Already Benefiting From TimeTrex
Time To Clock-In
Start your 30-day free trial!
Experience the Ultimate Workforce Solution and Revolutionize Your Business Today
- Eliminate Errors
- Simple & Easy To Use
- Real-time Reporting
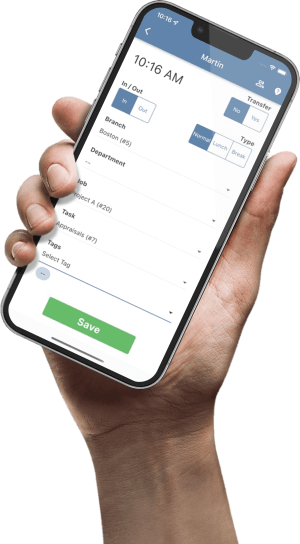

Saving businesses time and money through better workforce management since 2003.
Copyright © 2026 TimeTrex. All Rights Reserved.