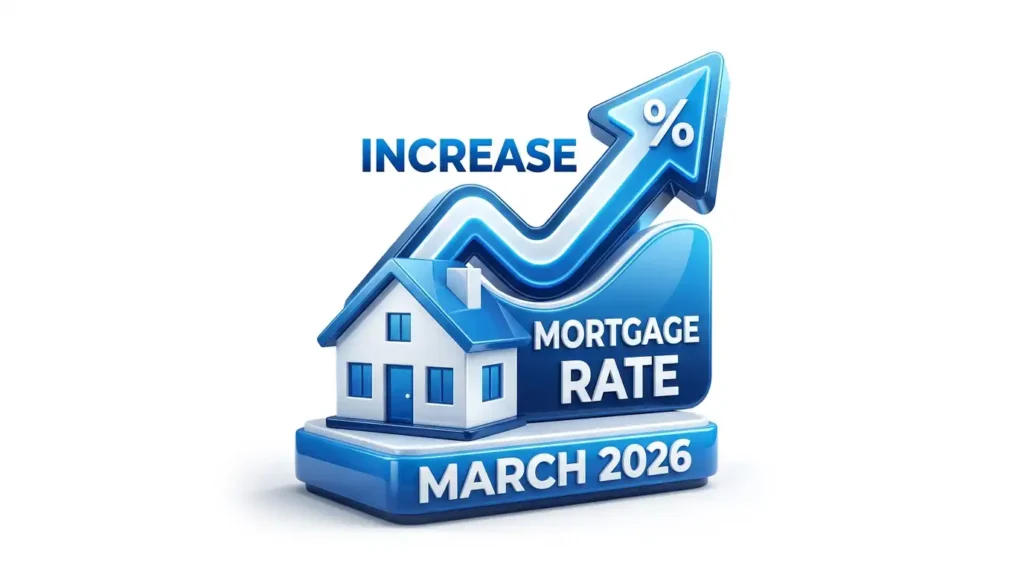

March 2026 Mortgage Rate Increase
TL;DR
The final week of March 2026 saw a sharp, destabilizing 11-basis-point surge in mortgage rates, erasing early-year affordability gains. Driven by Middle East geopolitical conflicts inflating global energy prices and stubborn domestic inflation, the benchmark 30-year fixed rate spiked to an average of 6.45% or higher. This volatility immediately crushed refinance application volumes by up to 18.5% in a single week and pushed prospective buyers toward Adjustable-Rate Mortgages (ARMs) and high-density condominiums. With no Federal Reserve rate cuts expected for the remainder of 2026, the era of sub-4% mortgages is structurally obsolete, cementing a "higher for longer" reality for the housing market.
Table of Contents
- Anatomy of the Late March Rate Surge
- Geopolitical Shocks and Global Energy Markets
- The Treasury Yield Connection and Sovereign Debt
- Federal Reserve Policy Disconnect
- Devastation of Mortgage Application Volumes
- National Homebuyer Sentiment and Inventory
- The Structural Shift to High-Density Housing
- The Boston Micro-Market Case Study
- The South Florida Anomaly
- Corporate Credit Conditions
- Long-Term Yield Forecasts and Outlook
The final week of March 2026 marked a profound and destabilizing inflection point for the United States housing finance sector. Following a brief period of tenuous optimism in the early weeks of the year, during which benchmark borrowing costs momentarily dipped to multi-year lows, the market experienced a violent, upward recalibration. On Friday, March 27, 2026, daily and weekly tracking indices recorded severe volatility, characterized most prominently by benchmark 30-year and 15-year fixed-rate mortgages surging by exactly 11 basis points across multiple prominent surveys. This sudden escalation erased the fragile affordability gains observed earlier in the quarter and introduced severe pipeline volatility for mortgage originators, fundamentally altering the trajectory of the spring homebuying season.
This exhaustive analysis provides a comprehensive examination of the macroeconomic catalysts driving this elevated rate environment. It details the immediate behavioral shifts among prospective homebuyers and refinancing candidates, dissects the extreme imbalances within national inventory metrics, and explores bifurcated regional impacts, with specialized focus on the highly anomalous South Florida real estate market, the rate-sensitive Boston micro-market, and the structural consumer shift toward high-density condominium housing.
Anatomy of the Late March Rate Surge
Mortgage rates are inherently volatile instruments that track global financial market sentiment, inflation expectations, and sovereign bond yields rather than direct central bank consumer lending directives. The data emerging on Friday, March 27, 2026, illustrates a market caught in the crosshairs of geopolitical anxiety and sticky domestic inflation. While different indices utilize varying lender survey methodologies, the consensus across all major barometers indicates a sharp, unmistakable steepening of the cost of capital.
According to the daily market survey conducted by NerdWallet and Zillow on the morning of March 27, the average interest rate on a 15-year fixed-rate mortgage experienced an acute 11 basis point increase, reaching 5.97% APR. Simultaneously, the average rate on a 30-year fixed-rate mortgage rose to 6.45% APR. This 11-basis-point volatility marker has been a recurring, mathematically precise theme throughout the month of March. Earlier in the month, the Mortgage Bankers Association (MBA) reported an identical 11-basis-point jump that pushed conforming 30-year rates to 6.30%. Furthermore, Freddie Mac's Primary Mortgage Market Survey (PMMS) recorded successive 11-basis-point weekly increases in both its March 12 and March 19 reports.
📈 Data Interpretation
To understand the gravity of an 11 basis point daily jump, it is crucial to examine the broader temporal trends. Over the past six months, the 30-year fixed mortgage rate has experienced significant volatility, driven by shifting monetary policies and inflation data. Today's spike interrupts a brief period of stabilization, pushing borrowing costs dangerously close to the psychological 7.00% threshold. The sharp upward trajectory illustrates the severity of today's increase relative to the gradual movements seen in previous weeks.
By the time Freddie Mac released its final March update, the 30-year fixed rate had accelerated even further, surging 16 basis points to a weekly average of 6.38%. Meanwhile, the daily tracker Mortgage News Daily (MND) recorded exceptionally aggressive intraday pricing. By the afternoon of March 26, the daily 30-year fixed rate on the MND index had leaped 14 basis points to hit 6.62%, pushing rates to their highest levels in over six months.
The fragmentation of these rates across different tracking methodologies highlights the extreme volatility that secondary market investors and retail lenders are currently navigating. To conceptualize the current pricing environment, the following table aggregates the national average mortgage rates across primary product categories as of late March 2026, capturing the spread between nominal interest rates and the Annual Percentage Rate (APR).
| Mortgage Product | Average Interest Rate | Average APR | Period Change |
|---|---|---|---|
| 30-Year Fixed (Conforming) | 6.45% - 6.875% | 6.86% - 7.174% | +11 to +16 bps |
| 15-Year Fixed | 5.815% - 6.125% | 5.97% - 6.555% | +11 bps |
| 20-Year Fixed | 6.50% - 6.875% | 6.51% - 7.265% | +5 bps |
| 30-Year Fixed (Jumbo) | 5.750% - 6.65% | 5.980% - 6.67% | +2 bps |
| 30-Year Fixed (FHA) | 6.125% - 6.148% | 6.86% - 6.985% | +17 bps |
| 30-Year Fixed (VA) | 5.97% - 6.250% | 6.02% - 6.652% | +3 to +7 bps |
| 5/1 ARM (Adjustable) | 6.58% - 6.95% | 6.95% | +35 bps |
| 10-Year Fixed | 5.731% - 5.88% | 5.776% - 5.90% | +3 bps |
The sudden expansion in the 5/1 Adjustable Rate Mortgage (ARM), which surged by a staggering 35 basis points in a single day to reach 6.95% APR, is particularly alarming. Typically, ARMs offer a lower initial rate to compensate for duration risk; however, the inverted yield curve and extreme short-term market anxiety have pushed ARM pricing above fixed-rate products in several lender portfolios, neutralizing a primary affordability tool for stretched homebuyers.
Geopolitical Shocks and Global Energy Markets
The upward pressure on domestic mortgage rates is not an isolated, organic phenomenon, but rather a direct symptom of cascading macroeconomic shocks. An 11-basis-point daily or weekly shift in mortgage-backed securities (MBS) pricing requires significant fundamental drivers to dislocate established trading ranges. In March 2026, the primary external shock dictating market conditions was the escalating geopolitical conflict in the Middle East, specifically involving the United States, Israel, and Iran.
Global financial markets abhor uncertainty, and military escalation in the Persian Gulf directly threatens global energy supply chains. By the final week of March, Brent crude oil prices spiked drastically. The benchmark hit an intraday high of $115 per barrel following retaliatory attacks against energy targets, including the massive liquefied natural gas hub of Ras Laffan in Qatar, before edging down and settling near $97.32 a barrel.
The transmission mechanism from oil prices to mortgage rates is highly correlated and remarkably swift in the current economic cycle. Energy prices serve as a foundational input cost for the broader global economy; when crude oil prices surge, the cost of manufacturing, transporting, and delivering all physical goods increases symmetrically. This dynamic instantly lifts broad, long-term inflation expectations. Bond investors operate strictly on real yield expectations. When inflation expectations rise, the future purchasing power of fixed-income returns diminishes. To compensate for this anticipated inflationary decay, bond investors demand higher yields, initiating a massive sell-off in bond prices that inherently drives up mortgage rates.
Real estate economists currently forecast that crude oil will average $101 per barrel throughout the entirety of 2026, with sustained peaks expected between $100 and $120 per barrel from May through October. This elevated energy floor fundamentally caps any downward potential for mortgage rates in the near term, as headline inflation is projected to accelerate to an average of 3.7% for the year, peaking near the 4% mark by mid-summer. Even news of the U.S. deploying thousands of additional troops to the Persian Gulf signaled to markets that a prolonged conflict was imminent, propping up both oil prices and interest rates.
The Treasury Yield Connection and Sovereign Debt Dynamics
Mortgage rates do not directly mirror the Federal Reserve's overnight lending rate. Instead, they are tethered to the yield on the 10-year U.S. Treasury note, plus a risk premium known as the mortgage spread. On Friday, March 27, the yield on the 10-year Treasury note experienced a violent upward expansion, spiking over 13 basis points to reach 4.447%, up from 4.358% the previous session. Earlier in the month, the benchmark 10-year yield had traded as low as 4.09%, illustrating the rapid deterioration of the bond market over a matter of weeks.
This surge signals severe distress and conflicting priorities in the bond market. Typically, the outbreak of major geopolitical conflict triggers a "flight to safety," where investors dump risk assets like equities and purchase sovereign bonds, thereby driving bond prices up and yields down. Indeed, the CNN Business Fear & Greed Index plummeted to a reading of 16 out of 100 on March 27, a level firmly entrenched in "Extreme Fear" territory.
Historically, such extreme fear would ease mortgage rates. However, the current macroeconomic relationship is inverted because the geopolitical crisis itself is fundamentally inflationary. Investors are trapped between equity risk and inflation risk, leading to tepid demand for longer-duration Treasury notes. A recent Treasury auction of 3-year notes saw notably weak demand, confirming that investors are demanding higher premiums to lock up capital.
Furthermore, long-term structural issues in U.S. fiscal policy are placing an artificial, mathematical floor under the 10-year yield. Macroeconomic modeling indicates a direct, causal correlation between the nation's debt-to-GDP ratio and sovereign borrowing costs. A widely accepted econometric rule of thumb dictates that for every single percentage point increase in the U.S. debt-to-GDP ratio, the equilibrium 10-year Treasury yield theoretically increases by approximately 3 basis points.
Given the projected 20-percentage-point increase in the national debt ratio over the coming decade, structural fiscal deficits alone are adding a permanent 60 basis point floor to long-term yields. This structural deficit, combined with political dysfunction and showdowns over the debt ceiling, fundamentally alters global investors' view of the safe-haven status of U.S. debt, severely limiting the capacity for mortgage rates to return to sub-5% levels regardless of future central bank interventions.
Federal Reserve Policy Disconnect
A pervasive misconception among retail consumers and mainstream market participants is that the Federal Reserve directly dictates consumer mortgage pricing. The empirical events of late 2025 and early 2026 provide stark evidence to the contrary. The relationship between the federal funds rate and the 30-year fixed mortgage rate is highly complex, non-linear, and currently disconnected.
Between September and December 2025, the Federal Open Market Committee (FOMC) executed three consecutive 25-basis-point cuts, successfully bringing the federal funds rate down to a target range of 3.50% to 3.75%. Yet, mortgage rates demonstrated a highly asymmetrical response. The following table illustrates the historical disconnect between FOMC policy decisions and the immediate subsequent movement in the 30-year fixed mortgage rate across late 2025 and early 2026.
| FOMC Meeting Date | Policy Decision | Target Fed Funds Rate | Mortgage Rate Prior | Mortgage Rate After | Immediate Net Change |
|---|---|---|---|---|---|
| May 7, 2025 | Hold (0 bp) | 4.25%–4.50% | 6.76% (May 1) | 6.81% (May 15) | +5 bps |
| Jun 18, 2025 | Hold (0 bp) | 4.25%–4.50% | 6.84% (Jun 12) | 6.77% (Jun 26) | -7 bps |
| Jul 30, 2025 | Hold (0 bp) | 4.25%–4.50% | 6.74% (Jul 24) | 6.63% (Aug 7) | -11 bps |
| Sep 17, 2025 | Cut (-25 bp) | 4.00%–4.25% | 6.35% (Sep 11) | 6.30% (Sep 25) | -5 bps |
| Oct 29, 2025 | Cut (-25 bp) | 3.75%–4.00% | 6.19% (Oct 23) | 6.22% (Nov 6) | +3 bps |
| Dec 10, 2025 | Cut (-25 bp) | 3.50%–3.75% | 6.19% (Dec 4) | 6.21% (Dec 18) | +2 bps |
| Jan 28, 2026 | Hold (0 bp) | 3.50%–3.75% | 6.09% (Jan 22) | 6.11% (Feb 5) | +2 bps |
As demonstrated, following the consecutive rate cuts in October and December 2025, mortgage rates actually rose by 3 and 2 basis points, respectively. Conversely, some of the largest week-to-week declines in borrowing costs occurred after "no-change" meetings, proving that mortgage pricing is driven by forward-looking bond-market expectations rather than reactionary central bank policy.
At its mid-March 2026 meeting, the FOMC elected to hold the benchmark rate steady at 3.50%–3.75%. Following the meeting, Fed Chair Jerome Powell and Governor Christopher Waller signaled that while the central bank typically ignores brief energy price spikes, because their monetary tools cannot drill for oil or resolve overseas wars, a sustained period of high oil prices creates immense systemic risk. They warned of a "self-fulfilling prophecy" where consumers and businesses expect higher inflation, which eventually manifests as entrenched, actual inflation.
Consequently, the institutional market underwent a violent repricing of forward expectations. Just weeks prior to the March 27 spike, investors had priced in two distinct Federal Reserve rate cuts for 2026. By late March, the CME FedWatch Tool showed the consensus had shifted entirely, expecting zero rate cuts for the remainder of the year, with speculative pricing even hinting at a potential rate hike if the Middle East conflict broadened.
The Federal Reserve's proprietary "dot plot" release in March 2026 confirmed this hawkish pivot. Most FOMC participants now anticipate the federal funds rate will hold between 3.25% and 3.75% through the entirety of 2026. More importantly, the "longer run" anchor rate has shifted definitively upward to 3.0%, signaling a collective, institutional belief that the neutral rate of the United States economy is permanently higher than previously estimated in the pre-pandemic era. This hawkish realization is the primary systemic driver behind the 11-basis-point leaps observed in late March mortgage pricing.
Devastation of Mortgage Application Volumes
The immediate secondary effect of this 11-basis-point interest rate shock is the rapid decimation of retail mortgage application volume. The housing finance sector currently operates with extreme rate elasticity, wherein origination margins are so deeply compressed that fluctuations of a mere fraction of a percentage point can drastically alter pipeline volume.
Data released by the Mortgage Bankers Association (MBA) throughout March 2026 reveals a devastating, sequential contraction in borrowing activity. The Market Composite Index, a definitive measure of total mortgage loan application volume, plummeted by 10.9% for the week ending March 13, followed by another massive 10.5% drop for the week ending March 20.
The Real Cost to Consumers & Refinance Demand
Basis points can often seem like abstract financial jargon. However, translating this 0.11% increase into tangible dollars reveals the immediate reduction in purchasing power. The most severe casualty of the March rate spike is the refinance market. In early February and early March 2026, when rates briefly dipped below 6%, refinance applications surged rapidly. For the week ending March 6, the refinance index was 81% higher than the same week one year ago, representing the strongest pace since 2022. This highlighted a significant pool of pent-up demand among borrowers holding 2023 and 2024 vintage loans with punitive rates above 7%.
Impact Analysis
The bar chart demonstrates the estimated monthly payment differences for principal and interest. While an extra $20 to $50 a month might seem manageable, it alters debt-to-income (DTI) ratios, potentially disqualifying borrowers hovering at the edge of approval limits.
However, as rates climbed back toward 6.50% in late March, this demand was instantly crushed. Refinance applications plummeted by 18.5% in mid-March, followed by another 15% plunge the subsequent week. The refinance share of total mortgage activity contracted rapidly to 49.6%, surrendering its brief majority share of the origination mix.
This acute, 15% drop in a single week underscores a structural reality of the contemporary mortgage market: the overwhelming majority of U.S. homeowners are locked into sub-4% mortgages secured prior to the 2022 rate hike cycle. The addressable market for refinancing is entirely constrained to recent originations, meaning that rate thresholds are exceptionally rigid. When rates push past 6.25%, the mathematical incentive to refinance vanishes entirely, shutting down major segments of originator volume overnight and leaving lenders scrambling to defend their pipelines.
Purchase Stagnation and Product Mix Shifts
Purchase applications, which are historically less sensitive to rate movements than refinances due to overriding life-event necessities (such as relocation, marriage, or family expansion), also registered a distinct and painful pullback. The seasonally adjusted Purchase Index decreased by 5% week-over-week in late March. High borrowing costs, compounding upon already elevated nominal home prices, have stripped purchasing power from the median buyer.
In response to this severe affordability crisis, borrowers who are forced to transact are exhibiting structural shifts in product selection. As fixed rates climb, borrower behavior inevitably shifts. We anticipate a notable rotation in the types of mortgage products consumers will pursue.
Current Mortgage Composition
🔍 Forecasted Market Rotation
The donut chart illustrates the dominant market share of the 30-year fixed mortgage prior to the rate hike. Our forecasting models indicate a probable shift.
Adjustable-Rate Mortgages (ARMs), currently at 12%, are expected to gain 3-5% market share as buyers leverage lower introductory rates to offset the 11 bps penalty on fixed products.
We expect a 20% increase in seller concessions utilized specifically for permanent and temporary rate buydowns (e.g., 2-1 buydowns) to artificially lower the new 6.96% rate.
- Government Lending Expansion: The Federal Housing Administration (FHA) share of total applications increased to 19.7%, up from 15.8% just a few weeks prior. Simultaneously, the Veterans Affairs (VA) share hovered between 15.9% and 17.1%. FHA loans, which cater to lower-credit and lower-down-payment borrowers, typically maintain slightly lower nominal interest rates, making them a refuge for stretched buyers.
- Systemic Delinquency Risks: The shifting landscape is exposing dangerous cracks in loan performance. New FHA loss-mitigation rules implemented late last year have restricted distressed borrowers to only one home-retention option every 24 months, while demanding a strict three-month trial payment plan. This effectively ended the pandemic-era practice of repeatedly extending forbearance relief. Consequently, severe delinquency rates among FHA loans surged markedly from 5.1% at year-end to 6.1% by late February 2026. This creates a growing, toxic pipeline of deeply delinquent FHA loans within Ginnie Mae securities, particularly among 2022-vintage originations, elevating servicing costs and buyout risks for institutional investors.
National Homebuyer Sentiment and Inventory Dynamics
The psychological impact of the 11-basis-point surge is profound. According to comprehensive late March data from Redfin, the weekly average mortgage rate hitting a three-month high has pushed prospective homebuyers firmly to the sidelines, creating a market characterized by intense friction. Pending home sales fell 1% year-over-year nationally, marking the sharpest decline in a month.
The financial burden on the average consumer is reaching historic extremes. The combination of rising mortgage rates and a 1.8% year-over-year increase in U.S. median home-sale prices (now sitting at $389,269) has driven the median monthly housing payment to $2,695. While this figure is technically down 1.5% compared to a year ago, it represents the highest median payment observed since June 2025 and is dangerously close to exceeding the strict debt-to-income underwriting thresholds of median wage earners.
Demand indicators confirm the cooling sentiment. While Google searches for "homes for sale" were technically up 16% year-over-year, actual physical touring activity was only up 23% from the start of the year, a notable deceleration compared to the 35% increase observed during the exact same period in 2025. The speed of sales has also decelerated, with the median days on market stretching to 56 days, which is 6 days slower than the previous year.
Metropolitan Buyer-Seller Imbalances
Despite the demand destruction caused by higher rates, national inventory remains severely constrained, creating a complex imbalance of power. Redfin's market analysis for early 2026 reveals an estimated 1,359,219 active buyers against 1,989,027 active sellers. While this creates a national gap of 629,808 more sellers than buyers, the largest gap on record dating back to 2013, total active listings actually decreased by 1.7% in late March, representing the biggest drop in inventory since 2023.
This contradiction is explained by the pervasive "lock-in" effect. The vast majority of homeowners hold sub-4% mortgages and categorically refuse to sell and forfeit their low rates unless forced by severe life events. Consequently, the market is characterized by ultra-low transaction volume, where constrained demand meets equally constrained supply. This dynamic effectively places a concrete floor under nominal home prices despite hostile financing conditions.
The buyer-seller dynamic is highly localized, producing vastly different market realities depending on the metropolitan statistical area (MSA). The following table illustrates the extreme variances in buyer and seller volumes across major U.S. cities in early 2026, defining the landscape of localized negotiating power.
| Metropolitan Area | Estimated Active Buyers | Estimated Active Sellers | Market Designation |
|---|---|---|---|
| Atlanta, GA | 21,337 | 37,680 | Buyer's Market |
| Austin, TX | 8,396 | 17,776 | Strong Buyer's Market |
| Chicago, IL | 25,112 | 25,676 | Balanced Market |
| Dallas, TX | 16,716 | 30,731 | Buyer's Market |
| Houston, TX | 22,402 | 45,345 | Strong Buyer's Market |
| Miami, FL | 7,512 | 19,726 | Strongest Buyer's Market |
| Nashville, TN | 7,077 | 15,540 | Strong Buyer's Market |
| New York, NY | 26,109 | 27,100 | Balanced Market |
| Newark, NJ | 8,085 | 5,573 | Strongest Seller's Market |
| Phoenix, AZ | 18,132 | 32,396 | Buyer's Market |
| Washington, DC | 15,524 | 18,418 | Buyer's Market |
As evidenced, markets like Newark, NJ, remain incredibly tight, favoring sellers, while Sun Belt boomtowns like Austin, Houston, and Miami are seeing sellers outnumber buyers by margins exceeding 100%, shifting immense negotiating leverage to the few buyers willing to brave 6.50% interest rates. These regional disparities are also reflected in pending sales data, where West Palm Beach, FL, experienced a massive 20.5% surge in pending sales, while New Brunswick, NJ, and Nassau County, NY, saw pending sales plummet by 19%.
The Structural Shift to High-Density Housing
Faced with a median monthly housing payment of $2,695, buyers who are forced into the market, due to expanding families, marriage, or corporate relocation, are increasingly compromising. Redfin premier agents note a distinct pivot away from traditional single-family detached homes toward high-density condominiums and townhomes to maintain strict budgetary compliance.
This shift to attached housing is a direct consequence of the 11-basis-point rate hikes pricing the middle class out of standalone properties. To understand the reality of this compromise, it is necessary to examine the actual condominium inventory available to buyers in major metros during the March 2026 rate spike. The following table provides a snapshot of granular real estate data, illustrating the exact price points, square footage, and amenities that define affordability in the current rate environment.
| City / Neighborhood | Address | Specs (Bed/Bath, Sq Ft) | List Price | Notable Features |
|---|---|---|---|---|
| Chicago (River North) | 340 W Superior St #1102 | 1 Bed + Den, N/A | $350,000 | Espresso shaker cabinets, skyline balcony views |
| Chicago (West Loop) | 125 S Jefferson St #1408 | 1 Bed / 1 Bath, 780 sq ft | $295,000 | Private balcony, 24/7 doorman, dog run |
| Seattle (Capitol Hill) | 505 E Denny Way #301 | 1 Bed / 1 Bath, 527 sq ft | $300,000 | Cityscape/water views, renovated kitchen |
| Seattle (Queen Anne) | 701 1st Ave N #204 | 1 Bed / 1 Bath, 1,054 sq ft | $575,000 | Bonus den, rooftop access, new appliances |
| San Diego (Clairemont) | 5252 Balboa Arms Dr #205 | 3 Bed / 2 Bath, 970 sq ft | $615,000 | Top-floor corner unit, soaring ceilings |
| Washington DC (Glover Park) | 4000 Tunlaw Rd NW #121 | 3 Bed / 2 Bath, 1,256 sq ft | $625,000 | Assigned parking, swimming pool access |
| San Francisco (South Beach) | 177 Townsend St #435 | 2 Bed / 2 Bath, 927 sq ft | $975,000 | EV charger parking, private movie theater |
These listings demonstrate that in primary coastal markets, buyers must spend between $500,000 and nearly $1,000,000 simply to acquire between 900 and 1,200 square feet of attached living space. At a 6.50% interest rate, financing a $600,000 condo with a 20% down payment requires a monthly principal and interest payment of over $3,000, exclusive of property taxes, insurance, and the exorbitant Homeowner Association (HOA) fees inherent to these high-amenity buildings.
The Boston Micro-Market: A Case Study in Rate Sensitivity
The paralyzing effect of the 11-basis-point surge is perhaps most visibly acute in ultra-high-cost tier-one cities like Boston. In the Boston metropolitan area, the median sale price stands at an intimidating $806,000, despite reflecting a 5.7% decrease compared to the previous year.
Redfin Premier agent Aditi Jain, who operates in high-end Boston suburbs like Lexington, Belmont, and Cambridge, notes that buyers in these markets have become incredibly sensitive to even microscopic rate fluctuations. "In Boston, where a mortgage payment can be $10,000 per month, small changes in rates make a big difference," Jain reported, noting that many buyers are actively waiting on the sidelines for rates to dip below 6% for a "meaningful amount of time" before submitting offers.
To grasp the magnitude of the capital required to navigate the Boston market, the following table details the median home prices across specific Boston neighborhoods and zip codes as of early 2026.
| Boston Neighborhood | Associated Zip Code | Median Sale Price (Feb 2026) |
|---|---|---|
| Beacon Hill | 02116 | $2,675,000 |
| Back Bay | 02116 | $1,795,000 |
| South End | 02118 | $1,250,000 |
| South Boston | 02127 | $1,200,000 |
| Jamaica Plain | 02130 | $869,000 |
| Charlestown | 02129 | $834,495 |
| Brighton | 02135 | $699,000 |
In surrounding affluent suburbs, the barrier to entry is even higher. Average home prices in Newton sit at $1,975,000, while Lexington reaches $2,598,500, and Wellesley tops the local market at $2,899,000. When dealing with loan principals exceeding $1.5 million, an 11-basis-point rate increase adds hundreds of dollars to the monthly payment and tens of thousands of dollars in lifetime interest costs. Consequently, luxury transaction velocity in debt-dependent markets like Boston is grinding to a halt until the Federal Reserve provides clear, dovish forward guidance.
The South Florida Anomaly: Cash Buyers and Condo Distress
While national aggregate data suggests a uniform cooling of the housing sector, macro-level statistics consistently fail to capture intense regional disparities. Miami-Dade County and the broader South Florida real estate market present a fascinating, fractured anomaly. In this region, the impact of an 11-basis-point rate spike is wildly bifurcated, creating two entirely disconnected housing economies: an ultra-luxury market perfectly insulated from debt costs, and a working-class market buckling under severe affordability constraints.
The Ultra-Luxury "All-Cash" Insulator
South Florida is currently the epicenter of domestic wealth migration. High-net-worth individuals, billionaires, and corporate executives from high-tax states like New York, California, and Washington continue to relocate to Miami, bringing vast reserves of liquid capital. High-profile relocations to "Billionaire Bunker" communities by figures such as Jeff Bezos, Ken Griffin, Mark Zuckerberg, and Tom Brady have cemented the region as a global wealth hub.
This demographic shift effectively neutralizes Federal Reserve monetary policy within the luxury asset class. In Miami-Dade County, an astonishing 59% of all million-dollar home sales year-to-date in 2026 were conducted entirely in cash. For ultra-luxury properties priced at $10 million and above, that figure skyrockets to 81%. Because these transactions do not rely on institutional financing, an 11-basis-point, or even a 100-basis-point, increase in the 30-year fixed mortgage rate has virtually zero impact on demand.
Furthermore, macroeconomic volatility actively benefits this segment. As geopolitical tensions rattle global equities, high-net-worth individuals and family offices seek safe-haven assets. Real estate in South Florida serves as a tangible portfolio diversifier against stock market turbulence. Consequently, total home sales in Miami-Dade rose year-over-year for the sixth consecutive month in February 2026, with single-family transactions up 4.3% and properties priced at $5 million and above climbing 11%. The Miami MSA currently leads the entire United States in all-cash sales, operating on liquidity rather than debt. Across the broader region, cash-heavy enclaves like West Palm Beach (82% cash buyers), Tequesta (80%), and Palm Beach (78%) remain utterly immune to the mortgage rate shock.
Condominium Market Vulnerability and Inventory Gluts
In stark contrast to the single-family luxury market, the Miami condominium sector is experiencing severe distress, driven by legislative overhauls and surging inventory. Following the tragic Surfside collapse, Florida enacted stringent structural safety and reserve funding mandates via HB 913. The massive financial burden of compliance, levied via six-figure special assessments, has forced many middle-class condo owners to liquidate their properties.
As a result, the months' supply of inventory for condominiums and townhomes in Miami-Dade County has surged, drastically altering the balance of negotiating power. The supply for million-dollar condos dropped to 18.4 months (down from an extreme 46.9 months a year prior), but overall median condo prices in Miami-Dade still fell by 9.9% year-over-year. In neighboring Broward County, condo supply sits at 20.3 months, while St. Lucie County active inventory has exploded to 22.6 months of supply.
This segment is highly sensitive to mortgage rates, as first-time homebuyers and local workers rely heavily on financing to purchase these units. The rate spike in late March further paralyzes this buyer pool, compounding the inventory backlog and driving prices down further.
Affordable Housing Initiatives and Loan Limits
The affordability crisis for the local South Florida workforce has prompted aggressive policy interventions. South Florida currently ranks first in the U.S. for multifamily construction activity, adding 36,290 units to the regional stock. Much of this is driven by Florida's "Live Local Act," which grants developers maximum density allowances if they allocate 40% of their units to affordable housing (defined as 120% or less of the area median income).
Developments such as Yaeger Plaza in Liberty City, the Brisas del Sol Apartments, and Magnus Brickell in downtown Miami highlight concerted efforts to utilize public land for public good, creating mixed-income workforce housing in high-cost corridors.
Furthermore, the Federal Housing Finance Agency (FHFA) has provided marginal relief to the middle class by increasing conforming loan limits based on a 3.26% average home price increase. In Miami-Dade County, the 2026 conforming loan limit for a single-family home was raised by $26,250 to $832,750.
| Property Size | 2025 Conforming Loan Limit | 2026 Conforming Loan Limit |
|---|---|---|
| 1 Unit | $806,500 | $832,750 |
| 2 Units | $1,032,650 | $1,066,250 |
| 3 Units | $1,248,150 | $1,288,800 |
| 4 Units | $1,551,250 | $1,601,750 |
This baseline increase is crucial; it prevents local homebuyers from being forced into the "jumbo" mortgage market, which carries significantly stricter underwriting requirements for down payments and credit scores, offering a vital lifeline as nominal borrowing costs escalate toward 7%.
Corporate Credit Conditions and Institutional Resilience
While retail mortgage borrowers face severe headwinds, it is vital to contextualize the 11-basis-point spike within broader corporate and institutional credit markets. The resilience of the banking sector and corporate borrowers indicates that the economy is adjusting to a higher cost of capital, which ironically gives the Federal Reserve more runway to hold rates higher for longer without triggering a systemic recession.
In the corporate bond market, high yield corporate bonds actually rallied on firming risk sentiment in March. The Bloomberg measure of the spread between high-yield bond yields and U.S. Treasury yields tightened by nine basis points to 292 basis points, retreating from multi-month highs. Furthermore, macroeconomic indicators like the Flash Manufacturing PMI came in at 52.4, beating estimates and indicating that the manufacturing sector is expanding despite elevated borrowing costs.
Global banking institutions are also demonstrating robust health. CaixaBank, for instance, reported that its non-performing loan (NPL) ratio stood at a remarkably low 2.71% in December 2025, representing a cumulative decline of 61 basis points from 2024. This occurred even as their private sector loan book recorded growth of 3.5%. Similarly, corporate entities like TD Synnex reported non-GAAP operating margin increases, positively impacted by approximately 11 basis points due to lower integration costs and product mix, proving that agile corporations can defend their margins in a high-rate environment. Because corporate America and global banks are absorbing the higher cost of capital without fracturing, the Federal Reserve is under no immediate pressure to slash rates to save the economy, leaving the retail mortgage borrower to bear the brunt of the restrictive policy.
Long-Term Yield Forecasts and Forward Outlook (2026-2027)
As the market digests the violent March 2026 volatility, forward-looking institutional projections remain cautiously elevated. The era of sub-4% mortgages is structurally obsolete, replaced by a "higher for longer" paradigm dictated by global multipolarity, energy market fragmentation, and staggering sovereign debt burdens.
Major industry organizations project that mortgage rates will remain relatively flat and elevated through the end of 2026. The 30-year fixed-rate mortgage is generally expected to center around the 6.00% to 6.40% range, offering little hope for a dramatic refinancing wave in the near term.
The following table aggregates the official end-of-year 2026 rate predictions from the nation's leading housing and finance authorities:
| Forecasting Institution | End-of-Year 2026 Rate Projection |
|---|---|
| Fannie Mae | 5.90% |
| National Association of Home Builders (NAHB) | 6.23% |
| Wells Fargo | 6.25% |
| Mortgage Bankers Association (MBA) | 6.40% |
| Zillow | > 6.00% |
Economists at Morgan Stanley project a slightly more optimistic, albeit temporary, mid-cycle dip. They hypothesize that if the benchmark 10-year Treasury yield moderates to roughly 3.75% by mid-2026, the 30-year fixed mortgage rate could temporarily decline to the 5.50%–5.75% corridor. Such a decline would generate meaningful improvements in affordability; for example, financing a $1 million home at 5.50% versus 6.20% results in a monthly payment reduction of approximately $358. However, Morgan Stanley's strategists caveat this forecast by warning that rates will inevitably rise again in the second half of 2026 and throughout 2027 due to persistent macroeconomic pressures and deficit spending.
Miami Realtors Chief Economist Gay Cororaton offers a distinctly more hawkish perspective, modeling a scenario where persistent geopolitical tensions and oil prices holding above $100/barrel push the 30-year mortgage rate to an average of 6.8% in 2026. In this scenario, rates are expected to touch 7% by mid-year before edging down slightly to 6.5% by year-end, remaining elevated at an average of 6.4% throughout 2027. Under these conditions, the broader national housing recovery is delayed until at least 2027, with overall transaction volume expected to decline by 3% in 2026 before seeing a modest 0.8% rebound the following year.
Ultimately, the 11-basis-point surge witnessed on March 27, 2026, is not merely a transient data anomaly; it is the tip of the spear in a broader macroeconomic realignment. The intricate web connecting Persian Gulf oil supply, U.S. Treasury swap spreads, and domestic housing affordability has never been tighter. Prospective buyers and industry stakeholders must navigate an environment where capital is inherently expensive, supply is artificially suppressed by lock-in effects, and the cost of debt is held hostage by volatile global externalities. The March rate shock serves as a clarion validation of the market's fragile, reactive reality, demanding rapid adaptation from originators, real estate professionals, and consumers alike as they chart a course through the remainder of the decade.
Strategic Adaptation Workflow
For active buyers currently in the pipeline, an immediate pivot in strategy is required. The flowchart below outlines the recommended immediate actions for stakeholders attempting to navigate the sudden 11 basis point increase without compromising their housing goals.
Assess Lock Status
Verify if the interest rate is locked or floating. Floating rates are subject to the new 6.96% baseline.
Recalculate DTI
Lenders must immediately recalculate Debt-to-Income ratios. The higher payment may trigger a loan denial.
Restructure Loan
If DTI is compromised, consider shifting to an ARM, adding a co-borrower, or increasing the down payment.
Execute & Lock
Once requalified under the new terms, secure a rate lock immediately to prevent exposure to further volatility.
Disclaimer: The content provided on this webpage is for informational purposes only and is not intended to be a substitute for professional advice. While we strive to ensure the accuracy and timeliness of the information presented here, the details may change over time or vary in different jurisdictions. Therefore, we do not guarantee the completeness, reliability, or absolute accuracy of this information. The information on this page should not be used as a basis for making legal, financial, or any other key decisions. We strongly advise consulting with a qualified professional or expert in the relevant field for specific advice, guidance, or services. By using this webpage, you acknowledge that the information is offered “as is” and that we are not liable for any errors, omissions, or inaccuracies in the content, nor for any actions taken based on the information provided. We shall not be held liable for any direct, indirect, incidental, consequential, or punitive damages arising out of your access to, use of, or reliance on any content on this page.
About The Author

Roger Wood
With a Baccalaureate of Science and advanced studies in business, Roger has successfully managed businesses across five continents. His extensive global experience and strategic insights contribute significantly to the success of TimeTrex. His expertise and dedication ensure we deliver top-notch solutions to our clients around the world.
Time To Clock-In
Start your 30-day free trial!
Experience the Ultimate Workforce Solution and Revolutionize Your Business Today
- Eliminate Errors
- Simple & Easy To Use
- Real-time Reporting

Saving businesses time and money through better workforce management since 2003.
Copyright © 2026 TimeTrex. All Rights Reserved.