Understanding Pay Period Frequencies
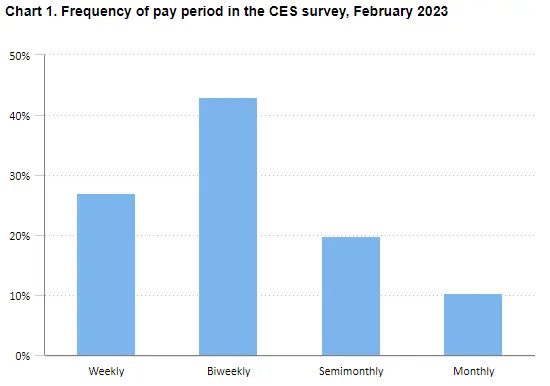
| Length of pay period | Percentage |
|---|---|
| Weekly | 27.0% |
| Biweekly | 43.0% |
| Semimonthly | 19.8% |
| Monthly | 10.3% |
| Source: U.S. Bureau of Labor Statistics, Current Employment Statistics survey. | |
Data Retrieved From: https://www.bls.gov/ces/publications/length-pay-period.htm
Insights from the BLS Current Employment Statistics Survey
The U.S. Bureau of Labor Statistics (BLS) undertakes the monumental task of administering the Current Employment Statistics (CES) survey, an essential mechanism for gathering and analyzing employment data. This survey is central to understanding the nuances of the U.S. labor market, providing critical insights into employment trends, wage patterns, and working hours across a broad spectrum of nearly 900 industries. The CES survey’s expansive reach, encompassing approximately 122,000 businesses and government agencies and representing around 666,000 individual worksites, ensures a rich and diverse dataset that reflects the multifaceted nature of the American workforce.
Critical Role of the CES Survey
The CES survey serves multiple key functions in the economic and labor market analysis:
- Economic Indicators: The data derived from the CES survey are pivotal in evaluating the health of the economy. By tracking changes in employment, hours worked, and earnings, economists and policymakers can gauge economic growth, identify trends, and make informed decisions.
- Industry Insights: With coverage of nearly 900 industries, the CES survey offers detailed insights into sector-specific employment trends. This level of granularity is invaluable for industry stakeholders, analysts, and researchers seeking to understand the dynamics within specific fields.
- Labor Market Flexibility: The comprehensive data collection reflects the labor market’s flexibility and adaptability. By monitoring how employment figures fluctuate in response to economic forces, the survey highlights the resilience and responsiveness of the American labor force.
Data Collection and Methodology
The CES survey’s methodology is designed to ensure accuracy and representativeness:
- Broad Sampling: The extensive sampling frame, including a wide array of businesses and government agencies, ensures that the data collected are reflective of national employment trends.
- Monthly Data Collection: Data are collected monthly for the pay period that includes the 12th of the month, providing a timely snapshot of labor market conditions.
- Normalization of Data: Given the variety of pay periods across surveyed establishments, the CES employs normalization techniques to standardize earnings and hours data on a weekly basis. This allows for consistent comparisons over time and across different types of businesses.
Key Takeaways from the CES Survey
The Current Employment Statistics (CES) survey, conducted by the U.S. Bureau of Labor Statistics, offers invaluable insights into the labor market’s structure and trends. Here are some of the key findings and methodologies that underpin the survey:
Pay Period Diversity: The CES survey uncovers a wide array of pay periods adopted by businesses across the United States, highlighting the diversity in how employees are compensated. This range—from weekly to monthly pay frequencies—illustrates the customized approaches businesses employ to meet both their operational needs and the preferences of their workforce. The existence of weekly, biweekly, semimonthly, and monthly pay periods signifies the flexibility and adaptability within the U.S. labor market, allowing for a variety of employment arrangements to coexist.
Normalization to Weekly Basis: A critical aspect of the CES survey’s methodology is the normalization of data to a weekly basis. This standardization is necessary for pay periods that extend beyond the traditional weekly cycle, such as biweekly, semimonthly, or monthly. By converting earnings and hours worked to a common weekly framework, the CES ensures that data across different pay periods are comparable, facilitating a clearer analysis of trends and patterns within the labor market. This normalization process is essential for producing coherent and actionable insights from the diverse data collected.
Weighted Data for Accuracy: To accurately reflect the labor market’s composition, the CES survey employs a weighting system for the data collected from participating establishments. Each establishment’s data is weighted based on its probability of being selected for the survey, which is determined by the establishment’s size and industry among other factors. This weighting approach corrects for sampling variability and biases, ensuring that the survey results accurately represent the distribution of pay period lengths across the entire U.S. private sector. This methodology enhances the reliability of the survey findings, making them a trusted resource for understanding employment trends.
February 2023 Findings: The survey’s findings for February 2023 highlight the predominance of biweekly pay periods, with 43.0% of U.S. private establishments utilizing this frequency for compensating their employees. This is followed closely by weekly pay periods, which account for 27.0% of the payment frequencies. Semimonthly and monthly pay periods are less common, underscoring a preference among businesses and employees for more frequent pay cycles. These statistics not only shed light on the current state of pay practices but also inform discussions around financial planning, employee satisfaction, and business operations.
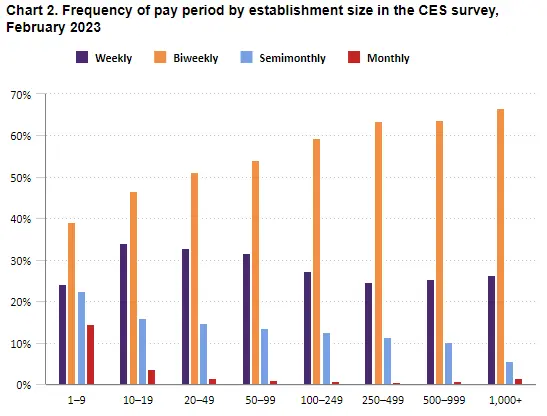
| Size | Weekly | Biweekly | Semimonthly | Monthly |
|---|---|---|---|---|
| 1–9 | 24.1% | 39.0% | 22.5% | 14.5% |
| 10–19 | 34.0% | 46.5% | 15.9% | 3.7% |
| 20–49 | 32.8% | 51.1% | 14.7% | 1.4% |
| 50–99 | 31.6% | 54.0% | 13.4% | 1.0% |
| 100–249 | 27.3% | 59.4% | 12.5% | 0.7% |
| 250–499 | 24.7% | 63.4% | 11.4% | 0.5% |
| 500–999 | 25.4% | 63.8% | 10.1% | 0.7% |
| 1,000+ | 26.3% | 66.6% | 5.6% | 1.5% |
| Source: U.S. Bureau of Labor Statistics, Current Employment Statistics survey. | ||||
Data Retrieved From: https://www.bls.gov/ces/publications/length-pay-period.htm
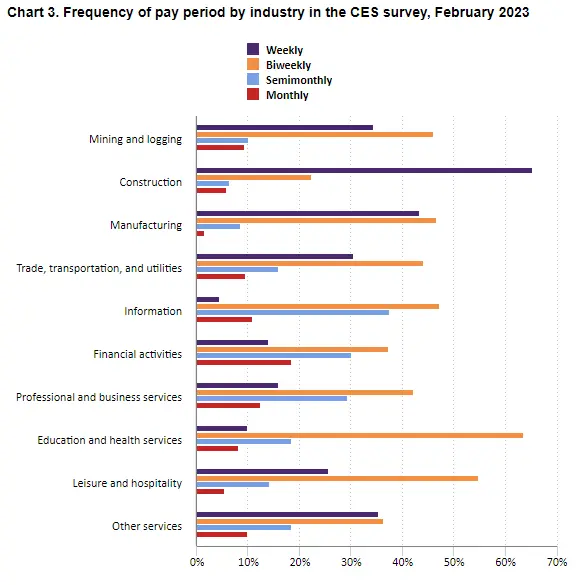
| Industries | Weekly | Biweekly | Semimonthly | Monthly |
|---|---|---|---|---|
| Mining and logging | 34.4% | 46.0% | 10.1% | 9.4% |
| Construction | 65.4% | 22.3% | 6.5% | 5.9% |
| Manufacturing | 43.4% | 46.6% | 8.6% | 1.5% |
| Trade, transportation, and utilities | 30.5% | 44.1% | 16.0% | 9.5% |
| Information | 4.4% | 47.2% | 37.5% | 10.9% |
| Financial activities | 14.0% | 37.4% | 30.2% | 18.4% |
| Professional and business services | 16.0% | 42.2% | 29.4% | 12.4% |
| Education and health services | 9.9% | 63.6% | 18.4% | 8.1% |
| Leisure and hospitality | 25.6% | 54.9% | 14.1% | 5.5% |
| Other services | 35.4% | 36.3% | 18.4% | 10.0% |
| Source: U.S. Bureau of Labor Statistics, Current Employment Statistics survey. | ||||
Data Retrieved From: https://www.bls.gov/ces/publications/length-pay-period.htm
Impact of Pay Period Frequency on the Economy and Workforce
The frequency with which employees are paid—their pay period frequency—plays a crucial role in shaping economic behaviors and workforce dynamics. This aspect of employment not only affects individual workers’ financial management but also influences broader economic patterns and business operations. Here’s a closer look at the impact of pay period frequency:
Budgeting and Financial Planning: For many workers, the timing of their paycheck is a critical factor in their financial planning and budgeting. Shorter pay periods, such as weekly or biweekly, provide employees with more frequent access to their earnings, facilitating better cash flow management and allowing for more immediate responses to financial needs. This can be especially beneficial for workers living paycheck to paycheck, as it reduces the time gap between income receipts, making it easier to cover ongoing expenses and emergencies. On the other hand, longer pay periods, such as monthly, require employees to plan more carefully, as they must stretch their earnings to cover a longer period. This can introduce challenges in managing expenses, particularly unexpected ones, and may require more disciplined budgeting and savings strategies.
Cash Flow Dynamics for Businesses: The choice of pay period also has implications for business operations, particularly in terms of cash flow management. Businesses that opt for shorter pay periods might experience more frequent deductions from their cash reserves to cover payroll expenses, which could impact their ability to make immediate large-scale investments or cover unexpected costs. In contrast, longer pay periods may provide businesses with a longer window to accumulate and utilize cash reserves for operational expenses, investments, or emergency funds. However, they also need to ensure that this approach aligns with employee needs and satisfaction, as longer gaps between paychecks can be a source of financial stress for workers.
Industry and Size Variations: The prevalence of certain pay period frequencies can vary widely across different industries and establishment sizes, reflecting the unique operational and financial landscapes of these sectors. For example, the construction industry, known for its project-based work and fluctuating demand, tends to favor weekly pay periods. This frequency aligns with the industry’s need for flexibility and supports the financial stability of its workforce, who may face irregular employment patterns. Conversely, larger establishments and corporations might prefer biweekly pay periods, balancing the need for efficient payroll processing with providing regular income for their employees. These variations underscore the adaptability of pay structures to meet both business requirements and employee needs across the economy.
Frequently Asked Questions (FAQ) about Pay Period Frequencies and Their Impact
Q1: What is a pay period?
A pay period refers to the recurring length of time over which an employee’s work hours are recorded and paid. Common pay periods include weekly, biweekly (every two weeks), semimonthly (twice a month), and monthly.
Q2: How does pay period frequency affect employee budgeting?
Shorter pay periods, such as weekly or biweekly, provide employees with more frequent access to their earnings, allowing for easier management of expenses and immediate financial needs. Longer pay periods, like monthly, require more careful financial planning and budgeting, as employees must allocate their earnings to last until the next payday.
Q3: Why do businesses choose different pay period frequencies?
Businesses may choose their pay period frequency based on various factors including industry standards, cash flow management, payroll processing efficiency, and employee preferences. Different frequencies can offer advantages in terms of operational flexibility, financial planning, and alignment with project or work schedules.
Q4: What are the implications of pay period frequency for businesses?
For businesses, the frequency of pay periods can impact cash flow dynamics, with shorter periods potentially leading to more frequent cash outflows for wages. However, longer pay periods may help in managing and planning larger investments or expenses due to the accumulation of cash reserves between payrolls.
Q5: How does pay period frequency vary across industries?
Pay period frequency can vary significantly by industry, reflecting unique operational needs and labor practices. For example, the construction industry often uses weekly pay periods due to the project-based nature of the work, whereas professional services or larger corporate entities may prefer biweekly or monthly pay periods for efficiency and consistency.
Q6: Can an employee negotiate their pay period frequency?
While it’s uncommon, employees can discuss and potentially negotiate their preferred pay period frequency with their employer. However, employers typically set pay periods based on operational efficiency, industry standards, and regulatory requirements, limiting the flexibility for changes.
Q7: How are earnings normalized to a weekly basis in the CES survey?
In the CES survey, earnings and hours reported for pay periods other than weekly are converted to a weekly basis to ensure consistency in data analysis. This normalization allows for direct comparison of earnings and hours across different pay frequencies.
Q8: What was the most common pay period frequency in February 2023 according to the CES survey?
According to the CES survey in February 2023, biweekly pay periods were the most common, with 43.0% of U.S. private establishments using this frequency. This was followed by weekly pay periods at 27.0%.
Q9: How does pay period frequency impact a business's payroll processing?
Shorter pay periods may increase the frequency of payroll processing, potentially raising administrative costs and workload. Conversely, longer pay periods could reduce the frequency of payroll tasks but require more detailed accounting and financial planning to manage the larger lump sums paid less frequently.
Q10: Are there any legal requirements regarding pay period frequency?
Yes, legal requirements for pay period frequency vary by country and, in the U.S., by state. Employers must adhere to minimum pay frequency laws, which dictate the longest interval allowed between employee paydays. These regulations ensure that workers receive their earnings within a reasonable and consistent timeframe.

Disclaimer: The content provided on this webpage is for informational purposes only and is not intended to be a substitute for professional advice. While we strive to ensure the accuracy and timeliness of the information presented here, the details may change over time or vary in different jurisdictions. Therefore, we do not guarantee the completeness, reliability, or absolute accuracy of this information. The information on this page should not be used as a basis for making legal, financial, or any other key decisions. We strongly advise consulting with a qualified professional or expert in the relevant field for specific advice, guidance, or services. By using this webpage, you acknowledge that the information is offered “as is” and that we are not liable for any errors, omissions, or inaccuracies in the content, nor for any actions taken based on the information provided. We shall not be held liable for any direct, indirect, incidental, consequential, or punitive damages arising out of your access to, use of, or reliance on any content on this page.
Trusted By
Trusted by 3.4M+ Employees: 23 Years of Service Across Startups to Fortune 500 Enterprises
Join our ever-growing community of satisfied customers today and experience the unparalleled benefits of TimeTrex.


Strength In Numbers
Join The Companies Already Benefiting From TimeTrex
Time To Clock-In
Start your 30-day free trial!
Experience the Ultimate Workforce Solution and Revolutionize Your Business Today
- Eliminate Errors
- Simple & Easy To Use
- Real-time Reporting

Saving businesses time and money through better workforce management since 2003.
Copyright © 2026 TimeTrex. All Rights Reserved.